The Stochastic Oscillator is a momentum-type indicator that identifies overbought and oversold positions. In other words, it can give an information on when traders can probably enter or leave the market. Other than that the indicator can be used in order to forecast future performance of the underlying asset. It was developed and implemented by George C. Lane in the 1950s.

How does it work?
Lane states that the indicator does not follow volume or price. Instead, it follows the speed or in other words, momentum of price. Generally, the momentum changes direction before price.
Consequently, the indicator may help traders forecast trend reversal points and this is utterly crucial in trading
The Stochastic Oscillator returns the ratio between the last closing price and the high-low range during a chosen period of time. It is based on the assumption that during the uptrends, prices will be higher than the previous period closing price. Moreover, during the downtrends, prices will probably be below the previous closing price.
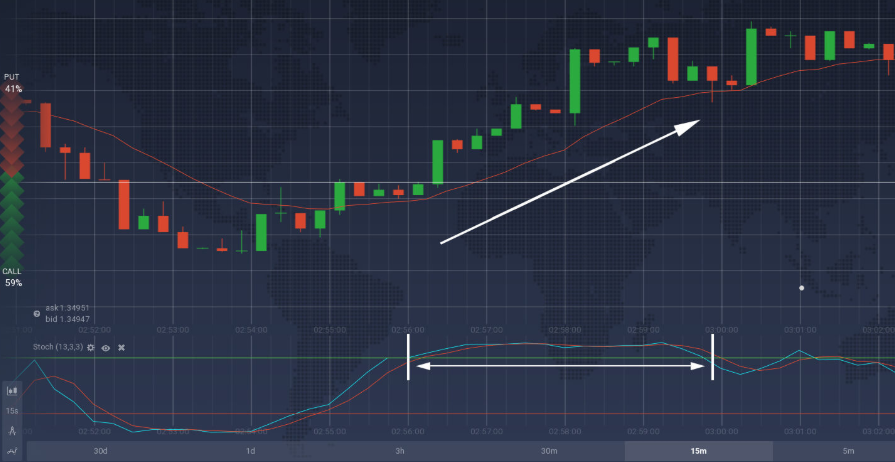
The oscillator contains of 2 horizontal lines and two moving average lines (the fast and the slow ones). By default the fast moving average line has a period of 3, while the slow moving average has a period of 13. The oscillator scale is from 0 to 100. Both levels, by default adjusted at 20% and 80% accordingly, correspond to two horizontal lines.
If the fast and the slow moving averages stay higher than the 80% level, the asset appear to be in the overbought zone. If both lines stay below the 20% level, the asset is considered to be in the oversold zone. Nevertheless, we have to mention that the decrease in prices does not mean that a signal to buy, as securities may stay in the oversold zone for certain time without leaving it. In addition, an upward price rise does not always show a motive to open a “Buy” position. Securities can stay overbought for quite long periods of time when there is a strong uptrend.
How to set up?
It is pretty simple to set up the Stochastic Oscillator indicator in the IQ Option platform.
- Click on the “Indicators” button in the bottom left corner of the screen.
- Go to the “Popular” tab and choose the Stochastic Oscillator from the list of options.
- Go to the “Set up & Apply” tab and, if you want to use the indicator with default settings, just click the “Apply” button.
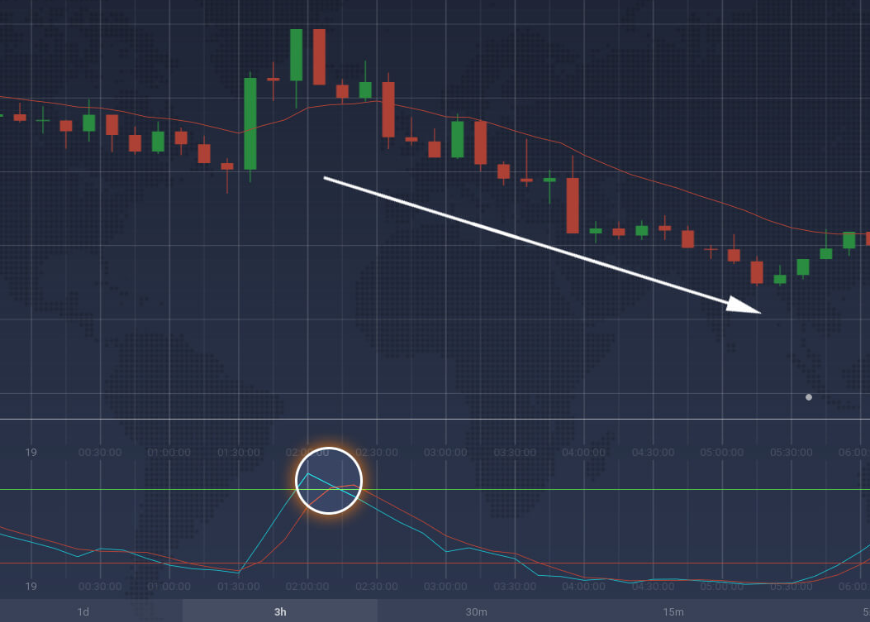
Or you can set parameters how you mostly prefer. You can change %K and %D periods and levels in order to have a higher accuracy.
The SO will appear in the bottom part of the screen, just below the price chart.
How to use it in trading?
The major purpose of the SO is to show the oversold and overbought levels and help traders on when it is better to open a position. There are some ways how to identify these cases using the SO and two of the following are usually used.
Overbought and oversold levels
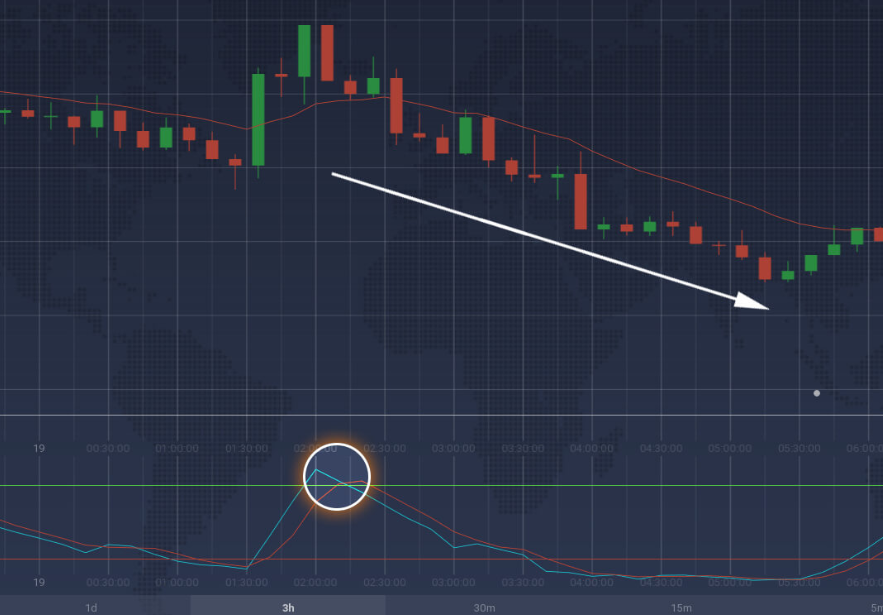
Sell signals
If both slow and fast moving averages are higher than the overbought level, the trend may be considered to be pessimistic. The fast MA crossing below the slow MA may be an extra signal of an upcoming downtrend.
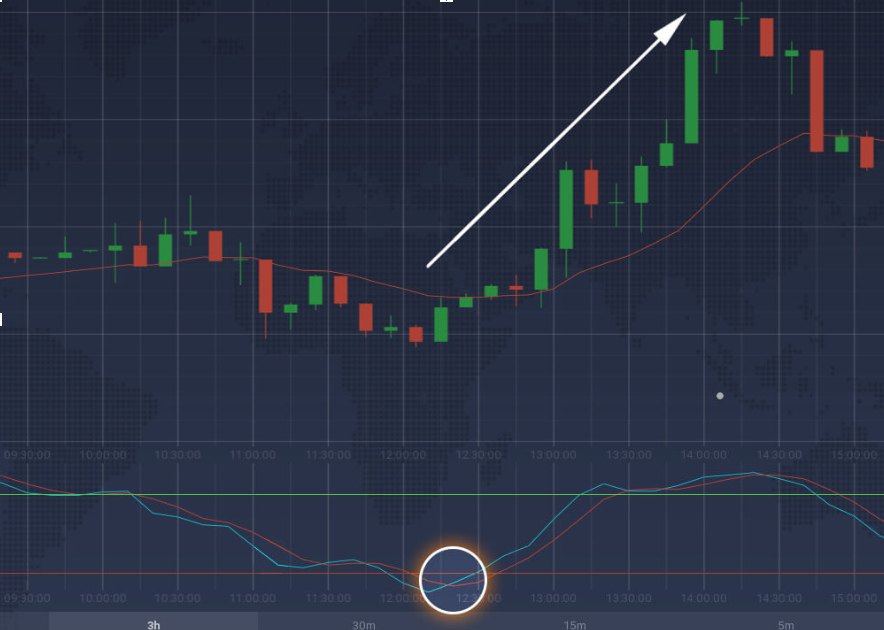
Buy signals
If both slow and fast moving averages are below the oversold level, the trend can considered to be optimistic. The fast MA crossing above the slow MA may become an extra signal of an upcoming uptrend.
Divergence
If the indicator and the price action start moving in different directions, it may be considered as a signal of an upcoming trend reversal. Divergences might be both bullish (optimistic) and bearish(pessimistic), as well.
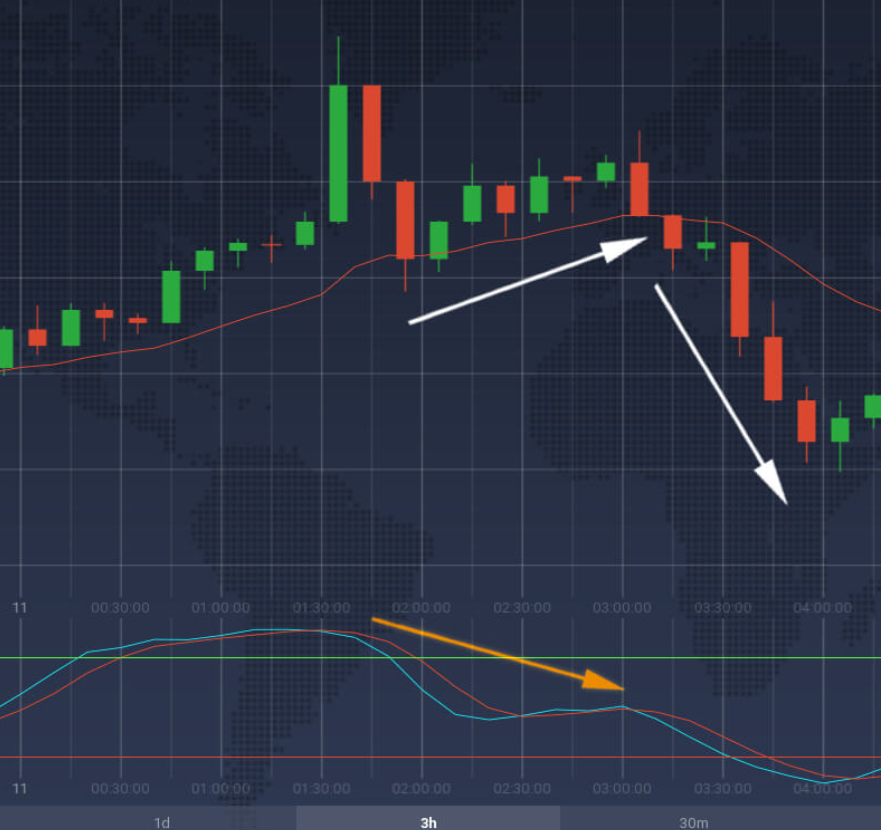
Nevertheless, we should state that the Stochastic oscillator, just as any other technical analysis tool, is not able to give correct signals all the time. At some point it will give false signals and in these cases you should not open an appropriate position.
Conclusion
The Stochastic Oscillator is a helpful and impressive technical analysis tool. In order to get the most out of it, you can use it together with other momentum indicators and trend-following indicators. You have to be careful when you work with the indicator because different levels do not always resemble an upcoming trend reversal.
Leave a Reply