What is IqOption ATR indicator?
Originally developed and introduced by Welles Wilder, ATR (Average True Range) is a technical analysis volatility indicator. ATR does not indicate the price trend, but serves the purpose of determining the degree of price volatility. Average True Range is one of the most reliable indicators of its kind. It aged really well and it is commonly used in many trading platforms today.

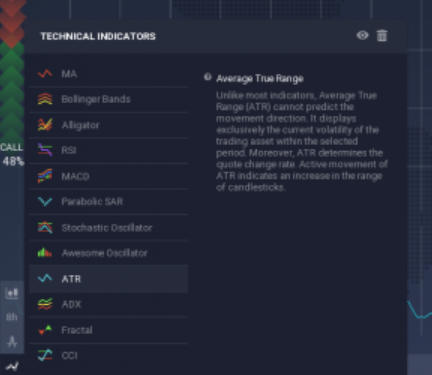
The look of ATR indicator in the IQ Option trading platform.
How does IqOption ATR work?
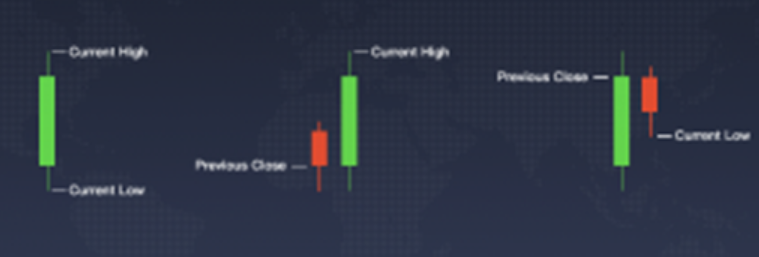
There is a simple idea behind this indicator. It’s all about constant fluctuations of currency exchange rates. Forex (Foreign Exchange Market) attracts sheer number of traders because of this high volatility as it provides good trading opportunities. Although trend direction can be very important, having to know when the trend begins is already helpful enough. Sometimes, if volatility is high enough, there is no need for acknowledging the exact direction of the trend. There are more than a few ways to approximate volatility of the market, and ATR has proven to be very efficient in this field. To truly understand how this indicator operates, you need to take a look at the calculation of the true range first. Largest metric of the following defines true range:
1. Most recent period’s high minus the most recent period’s low, 2. Absolute value of the most recent period’s high minus the previous close, 3. Absolute value of the most recent period’s low minus the previous close. Absolute values are used for number 2 and 3 to ensure positive numbers.

The true range is the largest of these three metrics.
Average True Range represents a moving average of the three ranges that we showed. By default, a 14-period moving average is used. This whole indicator is using one single line. Line jumps in the period of high volatility. On the other hand, when volatility is low, the line it plummets down.
How to set up IqOption ATR?
IQ Option platform makes ATR indicator really easy to be set up and used.
All you need to do is click on the icon “Indicators” that’s located in the bottom left corner of the window. Then just select ATR out of all indicators shown.

Setting up the indicator – Step one.
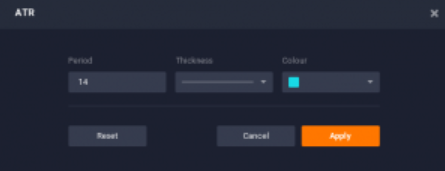
From there, you will just need to click “Apply” if you want to use the indicator with default settings. ATR will now be ready for use.

Setting up the indicator – Step two.
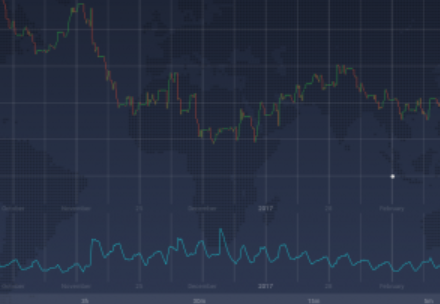
The indicator will show itself on the bottom of the window below the price chart.
Using ATR in iqoption trading
ATR can tell traders about the optimal periods to sell or buy.
Knowing the stability of the market is what gives trades the edge and that’s why ATR is widely used. High and low volatility are intermixed usually forming a wave looking line. After the market has been unstable for some time, the period of low volatility are likely to happen, and the other way around.

Wavy line at the bottom showing mixing of low and high volatility periods.
Using more Average True Range periods can indicate more accuracy, but trading signals may become low in quantity. On the other hand, cutting the number of periods down make you receive more signals, but with way less accuracy.
It is important to say that ATR uses absolute values instead of a percentage change. This makes comparison of different companies and different timeframes not possible.
IqOption ATR Conclusion
In conclusion, if you are looking to forecast the trend direction and price chart behavior, than Average True Range is not the indicator you should use as it does not lead you on to these information. However, traders love ATR as it’s the distinctive tool best used to provide precise information about the volatility of the market. In combination with some other technical analysis tools it can be a powerful instrument that makes entry and exit points easy to spot.
Leave a Reply