What is IqOption CCI Indicator?
CCI is the short form for Commodity Channel Index. Initially, this term has appeared in specialized literature back in 1970’s. The creator of CCI indicator is Donald Lambert, who has initially come up with this idea to be able to analyze the commodity markets, However, later the history has shown that if CCI works fine, it can be used for all types of financial sectors, however securities, currencies, as well as derivatives markets still remain impractical for CCI application.
This becomes obvious in case of non-stop cycles of crises, which get later replaced with stable periods when economy recovers. Market tends to excessively react to such events. The downs and ups may reach extreme levels that can cause the total collapse of certain corporations, and sometimes, even entire governments. However, eventually the world economy always manages to revert back to its average normal conditions.
Definition of iqoption CCI
Donald Lambert used CCI for calculation of stable intervals during fluctuations occurring in the commodity markets. Any abnormal deviations from the mentioned norms were deemed as a signal to change the direction to opposite, while relying on the assumption that the system will eventually recover from the extreme values and move back to the stable values in the middle.
In majority of cases the assumption of Lambert works just fine. If the indicator is set to “fast” mode (CCI appears under the chart with quotes), it becomes possible to observe the point where the line of CCI quits the “standard channel” and then observe that the indicator is correct in four cases (1), while in the fifth case the price drops (2).
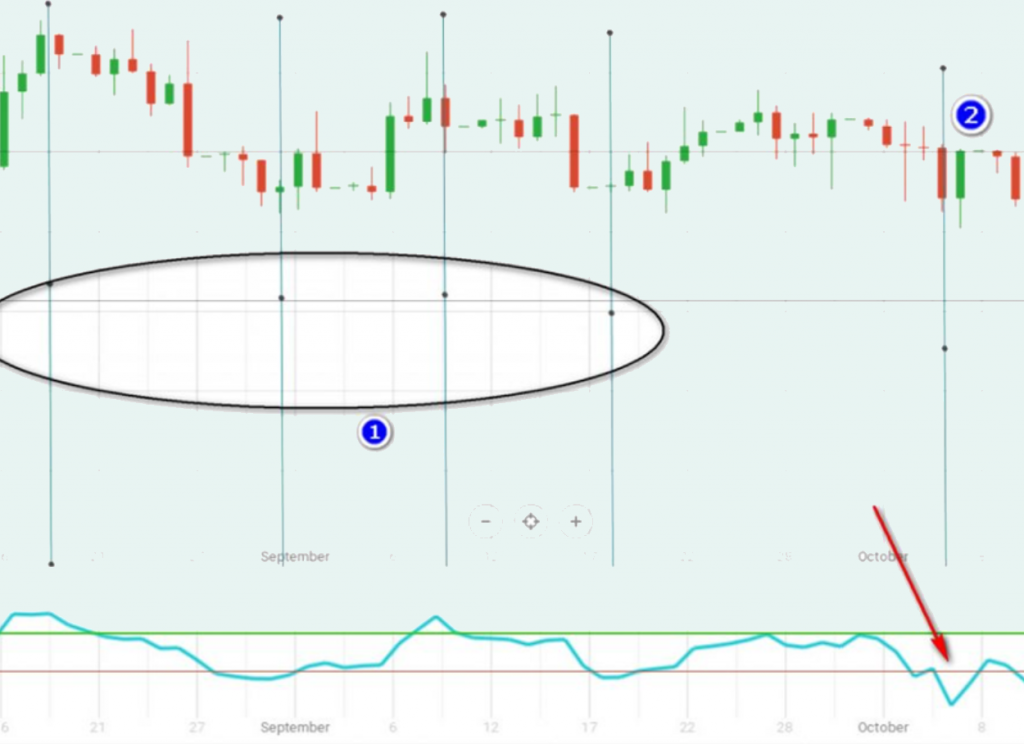
In all 4 cases the indicator is correct (1), however in the 5th case (2), the price drops.
So, what went wrong in case 5? The problem is caused by the indicator type. That is an oscillator, which represents a flat indicator that tend to “fold” once there is an appearance of trend. While price fluctuations remain within the steady range, CCI manages to perfectly detect reversals. However, once the asset price increases its momentum in one direction, then you can start observing some false signals.
Iqoption CCI Formula
The proper understanding of indicator application comes with detailed study of indicator’s algorithm. In case if you are not really good with mathematical formulas, then you can directly skip to the next part. However, it is very important to properly understand the basis behind tool performance in order to be able to utilize it in the most efficient manner. Market transactions stream creates candle with 4 price points: two extremes (4-high; 3- low), as well as opening (1) and closing (2).
Donald Lambert has come up with a term “Typical Price” (tp), which consists of extremes’ average price plus the closing price:
By applying this formula for every candle within the selected time period, it is possible to obtain the average values by applying the simple moving average formula SMA(tp):
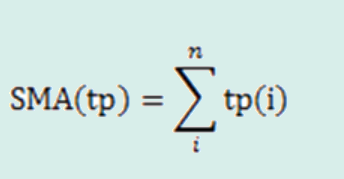
The stable price channel is determined by averaging all available ranges of deviations related to the typical prices based on the mean Moving Average Deviation (MAD). All deviations are taken as absolute values (in modulo).
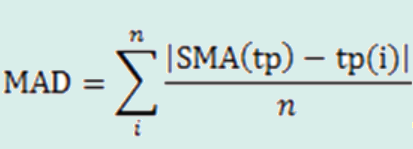
Once the channel problem is solved, it is requited to simply perform the comparison of the current deviation position of the typical price: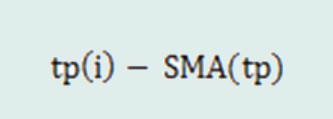
relative to the MAD. However, it is important to define the benchmark of “normal” deviation level?
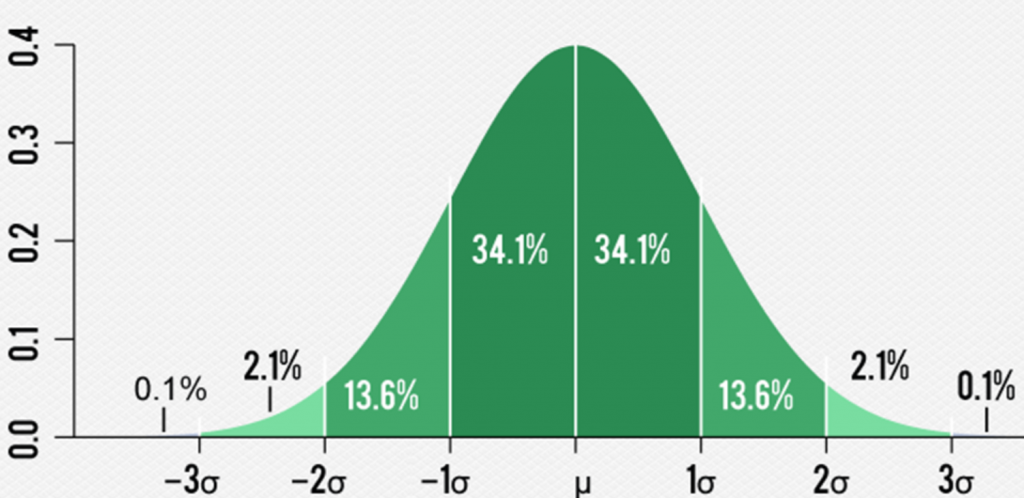
Donald Lambert selected a factor value of 2/3, which is based on the probability density of normal distribution (the “three sigma rule”). Likewise, there is a probability of 99.73% that some random values tend to appear within three deviations. Hence, moving outside 2 of them will result in correction. That is a basic approach, which is applied in lots of this type of indicators:
2/3 = 1/0.015, with the final CCI formula: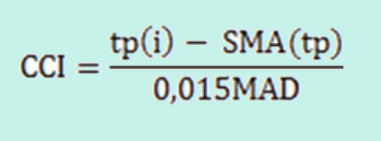
The levels defining the channel are considered to be equal to 100 (+100 represents the upper limit, while 100 represents the lower limit). In case of any oscillator, both overbought and oversold levels become intrinsic to CCI. In case of a flat market, the price tends to leave the channel very rare.
Steps to apply Iqoption CCI Indicator – Education for Trading
There are two general education for CCI oscillator application: crossing the +100 and -100 levels.
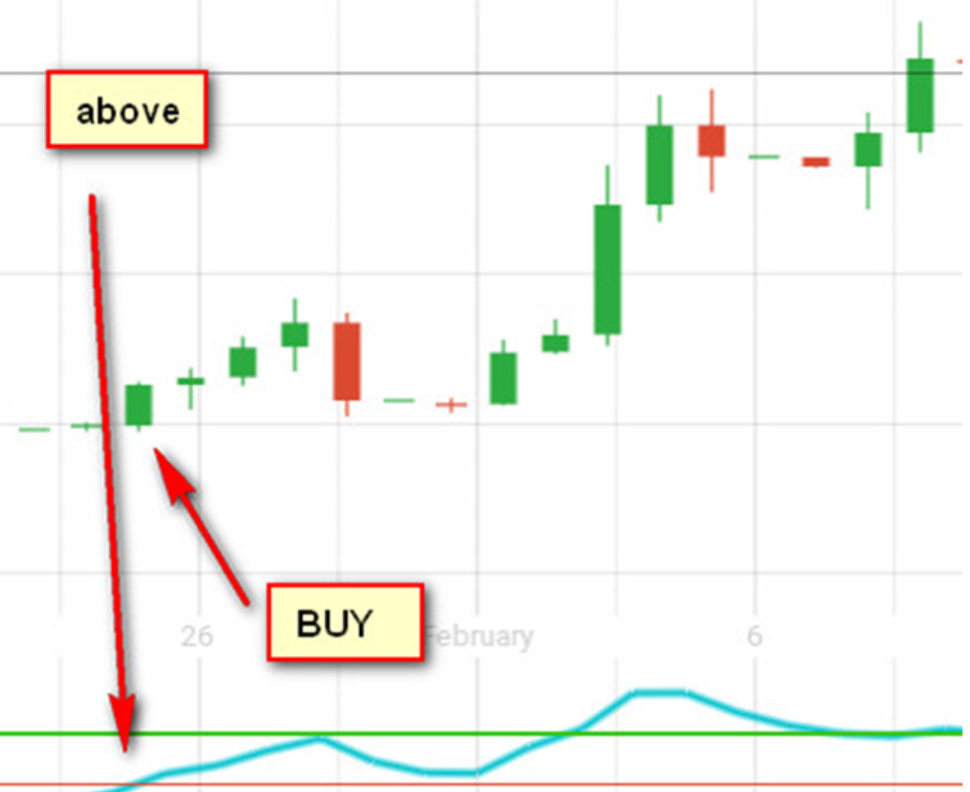
Likewise, it is the best to purchase the asset omce the CCI line manages to cross +100: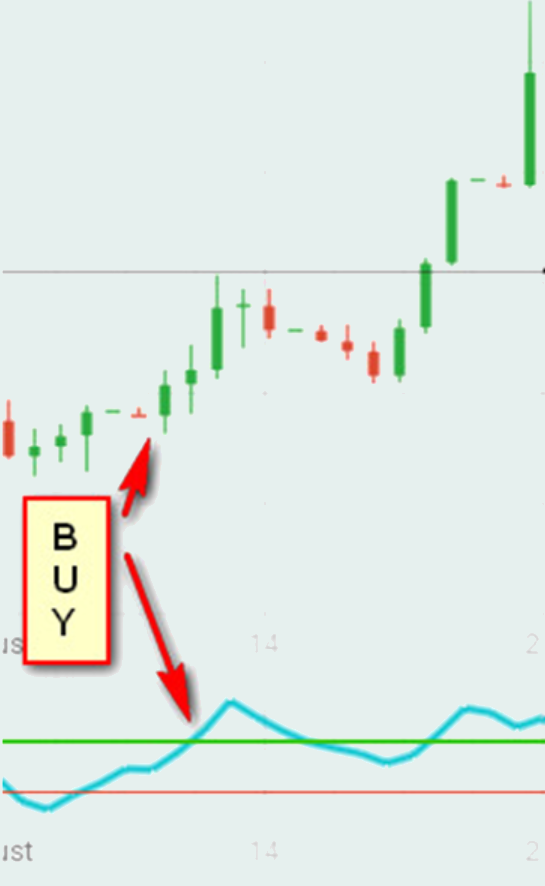
Start selling the asset once the CCI line intersects -100:
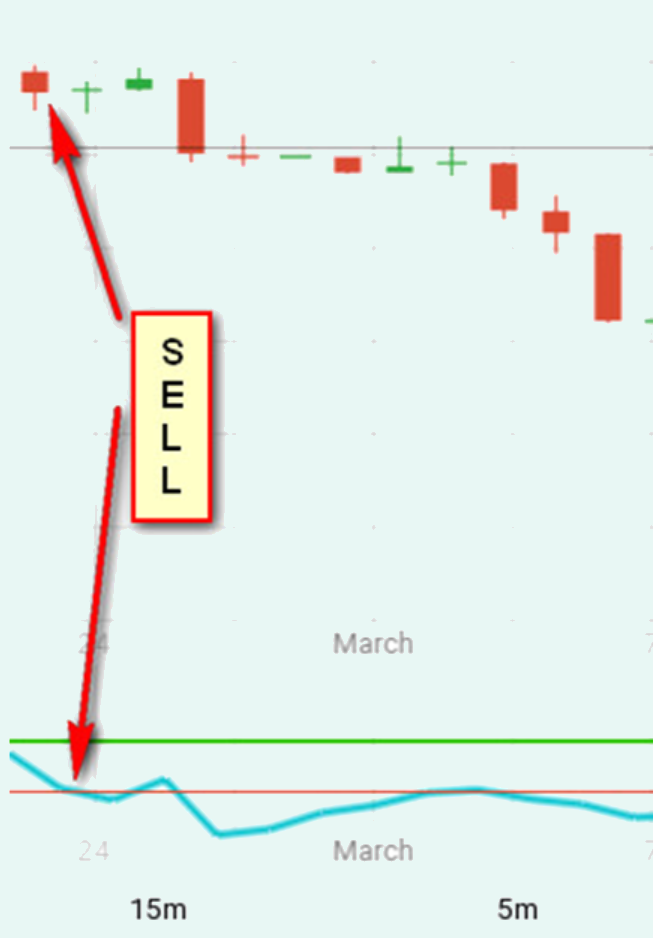
To be able to trade in flat channels, you need to open a deal once it crosses 100 and then reverses back higher or lower within that level. The diagram provided below displays CCI signal to sell:
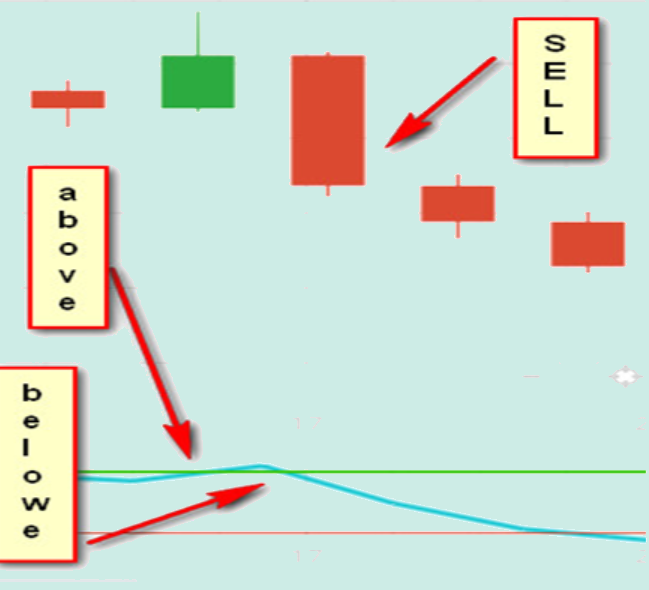
A method of buying in a flat channel is described as follows: wait until the line crosses the -100 level and prepare for trading. Once it reverses and then crosses the same level moving up, it is the signal to enter and purchase the instrument.
IqOption CCI Education
The following are the education of using CCI: trend, breakeven as well as counter-trend.
Breakeven education still remain relevant because of properly developed “step” approach for those market-makers, who build a position.
This is how it works. Every asset contains firms specializing in this particular instrument and continuously perform trading in it on both market sides. Market-makers have made it possible for any customer to sell or buy currencies 24/7 and receive the “market price” at all times without failing at all. Major financial institutions utilize the market-makers’ services. A huge capital amount should gradually enter the market in order not to lower or raise its entry price. Likewise, flat conditions of the market may in actual fact denote a building position. Once the news spread across the market, all traders start rushing to start trading in “that area”. Meantime the market-makers “give away” their positions in bits that they have previously had and can even set up a new position at its movement peak.

The market is represented in a form of series of flat sections related to a set of positions, which are followed by the quotes that rise to a “new level.”
Iqoption trading using the trend
Alternative approach suggests trading with the trend, based on the assumption that even a bad entry causing a loss will still be “pulled out ahead” right after the trend gets corrected.
The counter-trend education is used most commonly by day traders with a lot of transactions (trading turbo options) and scalpers. Scalpers pass up the trend in order to avoid a chase and “match” the correction with help of a counter-trend education.
In order to create a education, it is required to have a certain amount of secondary and primary indicators. Key indicators act as “donors” for signals. They are utilized to enter an asset trade (sell or purchase). All indicators contain a certain amount of false signals. There are plenty of them due to an oscillator, which is designed to trade in flat mode, is applied for a section which has directional movement.
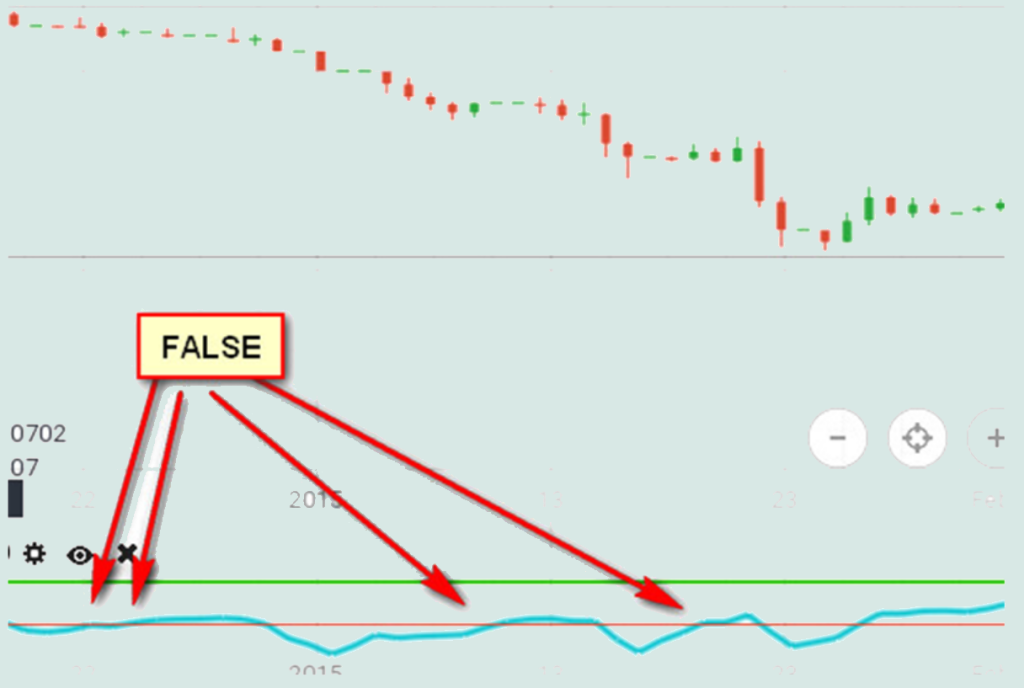
In order to be able to perform filtering out of those signals, it is required to utilize a trend indicator. However, that indicator type also gives wrong values when there is some movement sideways. Hence, we are required to have filters, which are able to confirm the presence of a directional trend on the market or it’s simply flat.
CCI is really suitable for creation of a trading system, thanks to the indicator’s algorithm, which provides entries for a flat section as well as for a trend. The ultimate goal for creation of trading education, is locate the filters, which are able to detect the market state: trend or flat. In ideal situation, those extra filters are used to assist traders to include the counter-trend elements in the education plan.
Since the concept of the education and the set objective are defined, which states that CCI is the signal donor, it becomes possible to start selecting appropriate filters.
Leave a Reply