Bollinger Bands (BB) is one of the most famous technical analysis indicator among traders worldwide. Bollinger Bands is a volatility indicator and it shows the dynamic range of price fluctuation. The volatility is higher when the distance between the lines is greater. Bollinger Bands may be used as a secondary tool that helps to identify the beginning and the end of the current trend. Overall, BB is an indicator which many traders have added to their trading arsenal. Nevertheless, there is one drawback that Bollinger Bands have, and it is the amount of space they take when applied to the price chart. As an indicator that is demonstrated directly on the price chart, it doesn’t match well with other indicators that need a lot of space such as Alligator, Fractals or Moving Averages. Well, there is one indicator that does everything mentioned above but more delicately. And this is Bollinger Bands Width.

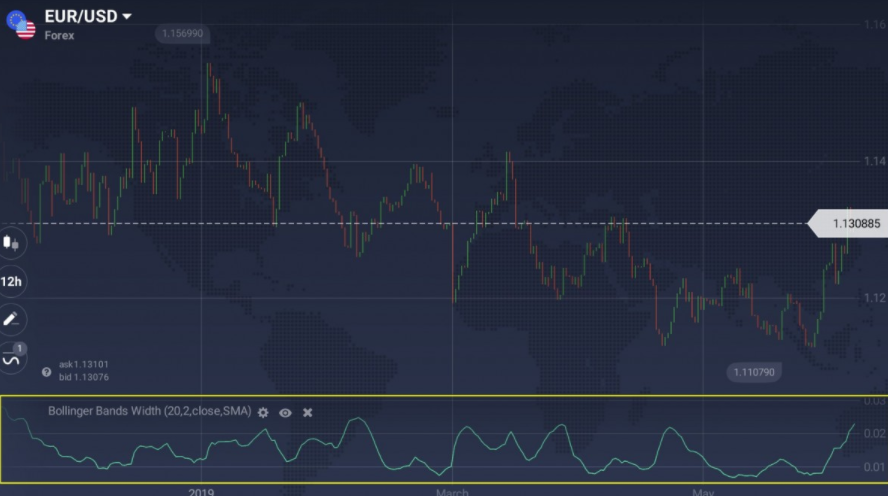
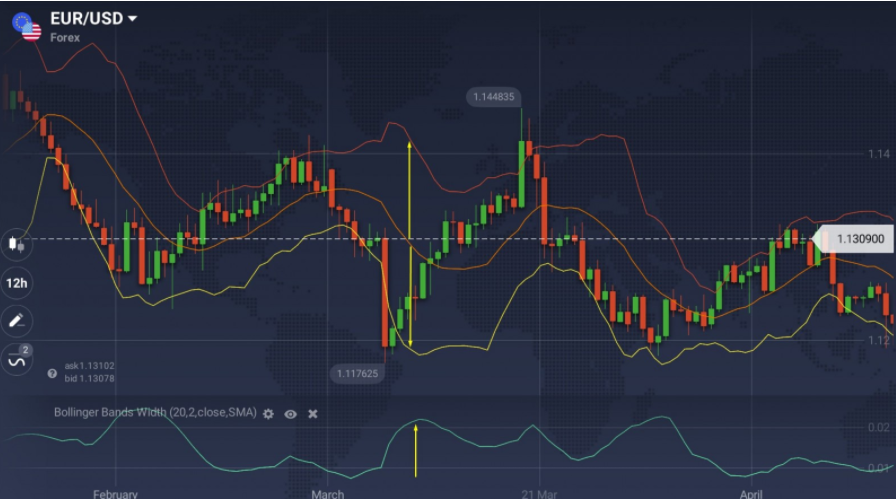
Bollinger Bands Width (BBW) is a technical analysis tool that is copied from Bollinger Bands. But BB Width takes the information that regular Bollinger Bands show as 3 different lines and connects it into one line. In other words, this tool calculates the distance between the upper and the lower bands. Now, we will explain how to start using it in trading.
How to use Bollinger Bands Width in trading?
BB Width works like an oscillator. If the volatility is high, the distance between the upper and the lower Bollinger bands rises, and the Bollinger Bands Width goes up accordingly. When the market is flat, and the distance between the bands goes down, the BB Width indicator will also move down.
Volatility is not a part of the the trend, and on its own high or low volatility doesn’t give BUY and SELL signals. Nevertheless, volatility is crucial just like the trading volume and trend direction, and it may help you identify the best entry and exit points.

High volatility periods mix with low volatility periods accordingly . The higher the volatility, the greater the potential upside but also the risk is greater. The lower the volatility, the lower the risk and the potential upside. Consequently, you can identify how risky is the trade you want to enter using the BB Width. Note that you can set the risk-return ratio according to your trading style.
Bollinger Bands Width is good at identifying market volatility, and that’s it. If you need to determine the trend direction or other metrics, it is wise to use other indicators. Volume and trend-following indicators can become a great complement.
Bollinger Bands Width Limitations
One difference between BB Width and regular BB is that BB Width represents as a single line and regular BB represent as three different lines. In addition, BB Width is located below the price chart in a separate window. Thus, BB Width cannot be used as a dynamic support and resistance level, but the regular BB can be used in this case.
Keep in mind that BB Width just like any other technical analysis tool, is not able to give correct signals all the time. It may and will sometimes send you false signals.
How to set up Bollinger Bands Width?
It is not difficult to set up the Bollinger Bands Width:
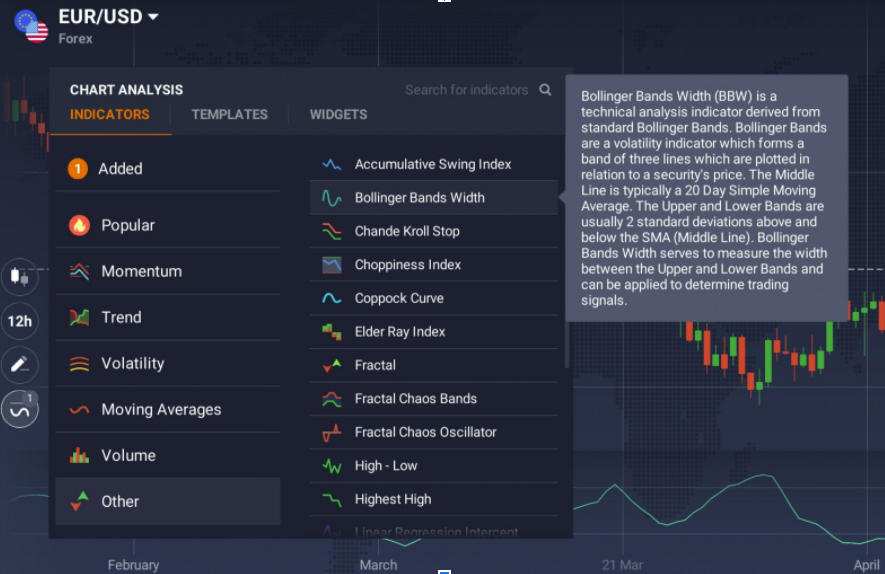
1. Click on the ‘Indicators’ button in the bottom left corner of the trade room
2. Go to the ‘Other’ tab

3. Choose the Bollinger Bands Width in the list of available indicators,
4. Don’t change the settings and click ‘Apply’ button.
You can use the indicator!
Now that you know how to set up and use Bollinger Bands Width in trading, you can go to the platform and try it yourself. Perhaps it will help you improve your trading performance.
Leave a Reply