Constructed by a financial analyst John A. Bollinger in the 1980’s, Bollinger Bands are a technical analysis indicators that serve to forecast price chart behavior by using standard deviation.
What are Bollinger Bands?
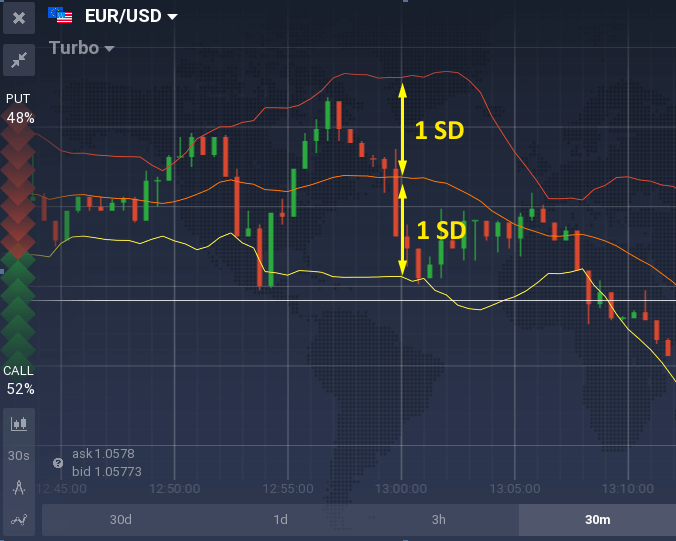
Bollinger Bands are volatility bands that are each placed above and below a moving average. Moving average is used to measure and predict the average price of a specific trading instrument. By adding and subtracting from this moving average, you get the standard deviation (SD), which is a measure used to qualify the amount of variation. This estimates the specific asset’s price volatility in the future.

The trading bands are one standard deviation (SD) away from the moving average
Basically, if the standard variation is bigger, the price range for a specific asset will be wider for the given time period. This deviation measuring is very useful when you want to predict future price fluctuations.
How do IqOption Bollinger Bands function?
There is a total of three lines that the indicator consists of. The middle one represents the exponential moving average, while the ones above it and below it represent price channels. These price channels can widen and contract depending on the price action. High volatility causes widening of the lines, while the lines are closer together when the market is still. Volatility is one of the most important indications for investors, as these volatile markets provide them with more trading opportunities. The key to understanding how Bollinger Bands work, you must understand the simple concept behind them, which is that when a certain price level drops or rises more than usual, it is expected for it to recur. Bollinger Bands are helpful in predicting big market movements that are usually preceded by periods of low volatility. Traders use these methods to establish the optimal time and price for investors to buy.
Setting up Bollinger Bands
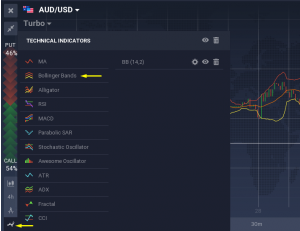
Bollinger Bands are easily set up in the IQ Option platform. In the bottom left corner of the screen you will find the “Indicators” button. From here, you just select “Bollinger Bands” among the list of indicators.

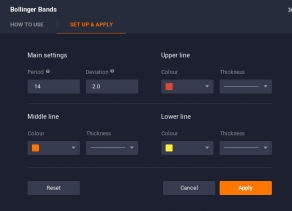
If you wish to work with recommended settings, you just click “Apply” and you’re ready to go. If you wish to adjust the period and the standard deviation on your own, you can do so by going to “Set up & apply” tab.

After setting up, click “Apply”, and your indicator will be ready for use.
IqOption Bollinger Bands uses in day trading
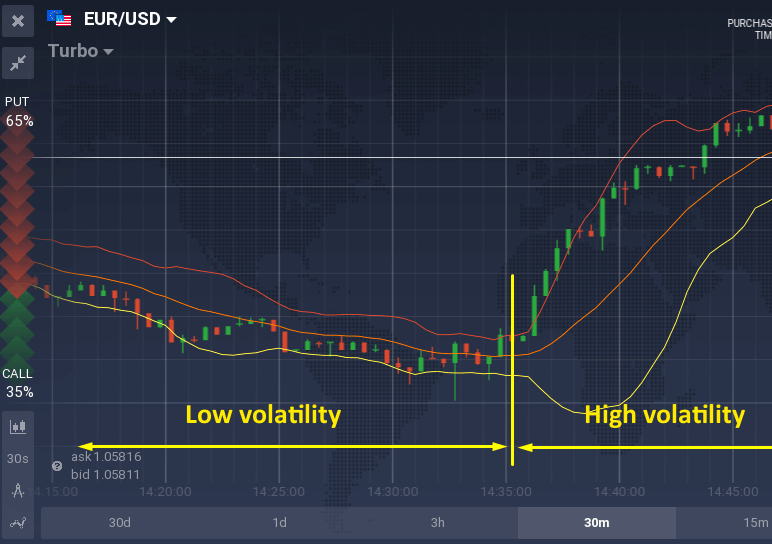
Effectively using Bollinger Bands in day trading requires the basic knowledge of price volatility characteristics and its applications in trading. Price fluctuations differs in the periods of downtrends and uptrends. Low volatility periods are characterized with the price fluctuating between the average line and the lower band. However, in the periods of high volatility, the price usually lies around the upper band or between the upper band and the average line.

Market being still increases the chances of the following volatility increase. Identifying such increase is what Bollinger Bands are perfect for. Traders love this indicator as it is ideal for forecasting future volatility fluctuations while determining oversold and overbought positions, making the deal opening at the most beneficial time frame. Once the asset breaks out from between the two bands, traders usually put a stop to new deal openings and wait for the stabilization of the market.
Iqoption Special features, The squeeze
The squeeze is a time when two bands start moving closer to each other. This indicates low volatility and it also means that a period of high volatility is about to occur in the near future. The downside of this indication is that it does not provide you with the exact information of the moment of increase. This is why during this time most traders are inactive.
Breakouts
From time to time price action can leave the area between two bands and jump out of the normal price range. This is called a breakout. Breakout rarely occur as 90% of the time price action is located between the bands. Since it does not indicate any future direction, breakouts are usually the time when traders wait for the market to stabilize.
Combining with other indicators
Using Bollinger bands as the only indicator is not ideal, as it is not a universal trading tool. As the creator itself said, the best way for the Bollinger Bands to be effective is if it’s used alongside other indicators. This combination will ensure the highest possible predictability and effectiveness.
IqOption Bollinger Bands Conclusion
In conclusion, Bollinger Bands are a great indicator widely applied in the world of trading. Easy to use and learn, it can give traders precise buy and sell signals, giving them advantage over the other market competitors. One of the most effective and commonly used and proven to work strategies is reflected in buying stocks when the average live goes below the lower Bollinger band and selling stocks when it surpasses the upper band.
Leave a Reply