What is Iqoption awesome oscillator?
(AO for short) is a histogram-looking indicators developed by technical analyst Bill Williams that serves in measuring of the market momentum. Using a wider time frame, AO indicates the change in momentum of a currency pair in current trading. Verifying the trends and establishing potential reversal points make this tool as awesome as its name.

How does IqOptions Awesome Oscillator works?
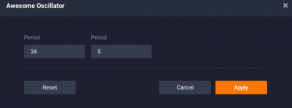
The concept of the Awesome Oscillator is not that complicated. In short, the indicator is a moving average crossover. A 34-period simple moving average is subtracted from a 5-period simple moving average. Both lines are implemented over the center of the bars instead of closing/opening prices.
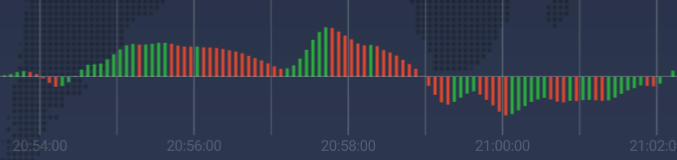
The AO values can move over or under the zero line. Values are simply represented as green and red bars. When the bar is red it means it has lower value than the previous one. When the bar is green it indicates its higher value from the one preceding it.
How to set up it on iqoption?
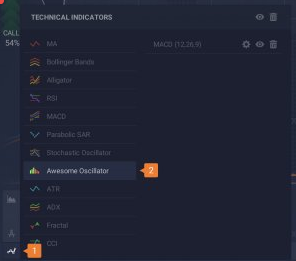
Using simple steps, we will show you how to set up the Awesome Oscillator in the IQ Option platform. In the bottom left corner of your window, you should click on the “Indicators” button. This will open up a list of all the indicator. Select “Awesome Oscillator” from the this catalogue.
From here just click on the “Apply” and Awesome Oscillator will appear under the price chart on your window.
You are now ready to use The Awesome Oscillator.
How to read iqoption Awesome Oscillator? Zero Line Cross
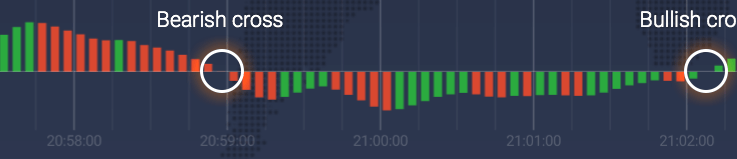
Zero Line Cross is pretty basic and easy to read signal. Focus is on the zero line and when that line is crossed by AO. When the AO goes over the zero line, it means the short-term momentum is more powerful that the long-term momentum. This indicates an uptrend and a strong buying signal. Alternatively, when the AO goes under the zero line, it means that the short-term momentum is weaker than the long-term momentum. This is a selling signal to most traders.
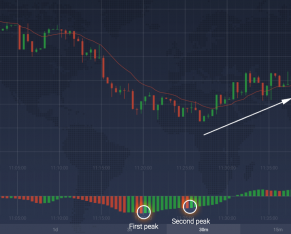
Twin Peaks
Twin Peaks are a little harder to read, but nevertheless pretty straightforward. They appear as 3 distinctive signs when indicating an uptrend: 1. Both peaks are under the zero line, 2. The second peak is closer to the zero line and is succeeded by a green bar, 3. The rack between both peaks remains under the zero line.
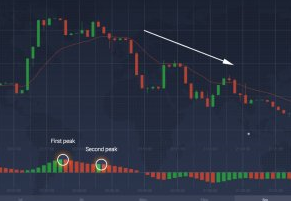
Twin Peaks signal a downtrend when following happens: 1. Both peaks are over the zero line, 2. The second peak is closer to the zero line and is succeeded by a red bar, 3. The rack between both peaks remains over the zero line.
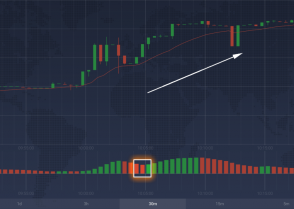
Saucer
Saucer is represented as a dent in the AO histogram. Following three bars in a row can show a bullish or bearish signal. In the case when the AO is over the zero line and two red bars in a row are succeeded by a green one, sauces is showing an uptrend.
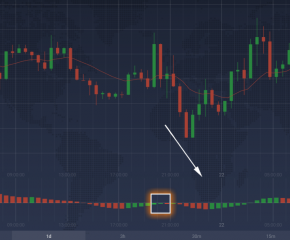
Alternatively, in the case where AO is under the zero line and two green bars in a row are succeeded by a red one, the saucer indicates a downtrend.
Although The Awesome Oscillator is simple yet powerful analysis tool that can indicate momentum shifts and potential reversal points, it is advised to use it carefully and with the help of other indicators and larger time frames as well.
Leave a Reply