What is IqOption Stochastic Oscillator?
When trying to establish the precise overbought and oversold positions, traders often use what is called The Stochastic Oscillator. Basically, it supplies investors with the information on entry or exit points. Introducing it in the 1950’s, George C. Lane is the father of this indicator that is also referred to as “Lane’s stochastics”.
How does the iqoption Oscillator indicator work?
As the author himself stated, The Stochastic Oscillator follows the speed or the momentum of the price, usually changing direction before the price, making it a really powerful tool for determining future price movements. This way, traders can get the valuable insight on trend reversal points that guarantees successful and precise predictions.
The term “stochastic” is used to point to a current price in relation to its price range over a period of time. When the trend goes upwards, chances are that the prices will be over the previous period’s closing price. On the other hand, when the trend heads downwards, prices go under the previous closing price.
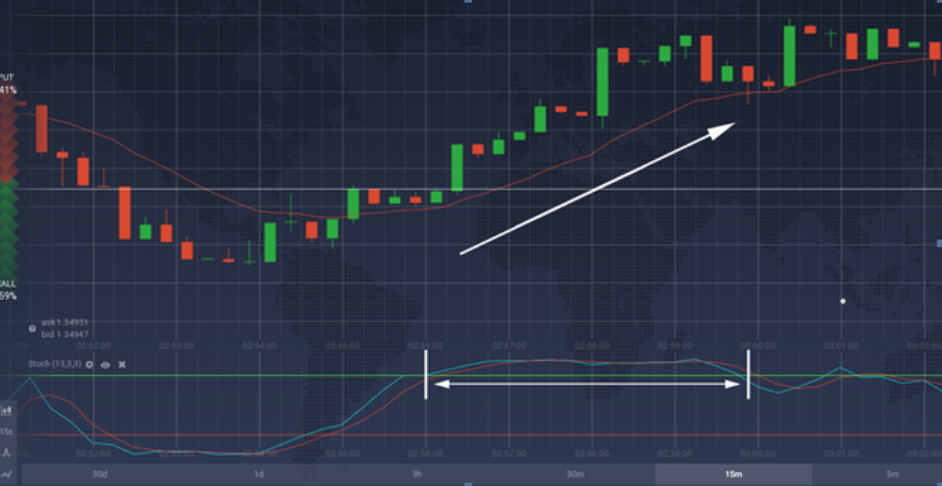
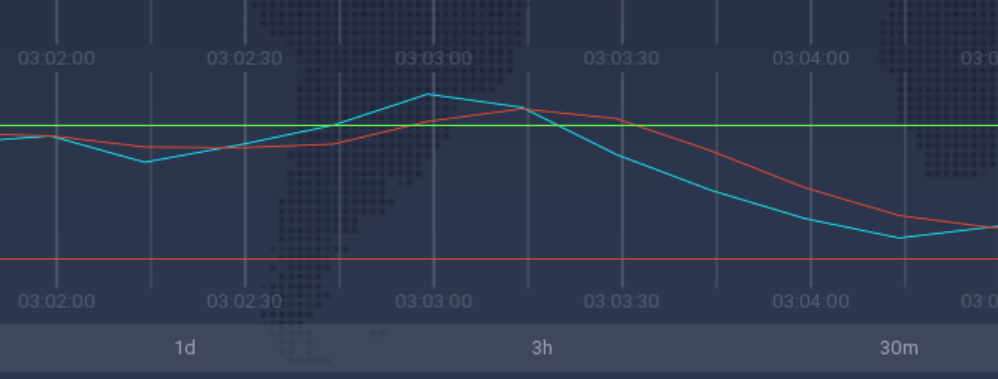
The indicator is made of four lines in total. Two lines moving horizontally, and two lines that represent moving averages (fast and slow). Horizontal lines represent both oversold and overbought levels (default setting at 20% and 80%). By using default settings, fast moving average line’s period equals 3, while the slow moving average line has a period of 13. The values can go from zero to 100.
When the moving average lines exceed the green line (80%), it means that the asset is overbought. Alternatively, when both moving average lines drop below the red line (20%), it means the asset is oversold. It is important to note that when the lines are in the oversold or overbought positions, it does not indicate the trend. Sometimes in the periods of strong uptrend, lines can remain in the overbought position for quite some time, and vice versa.
How to set up IqOption Stochastic Oscillator?
IQ Option platform makes it really simple to set up any indicator.
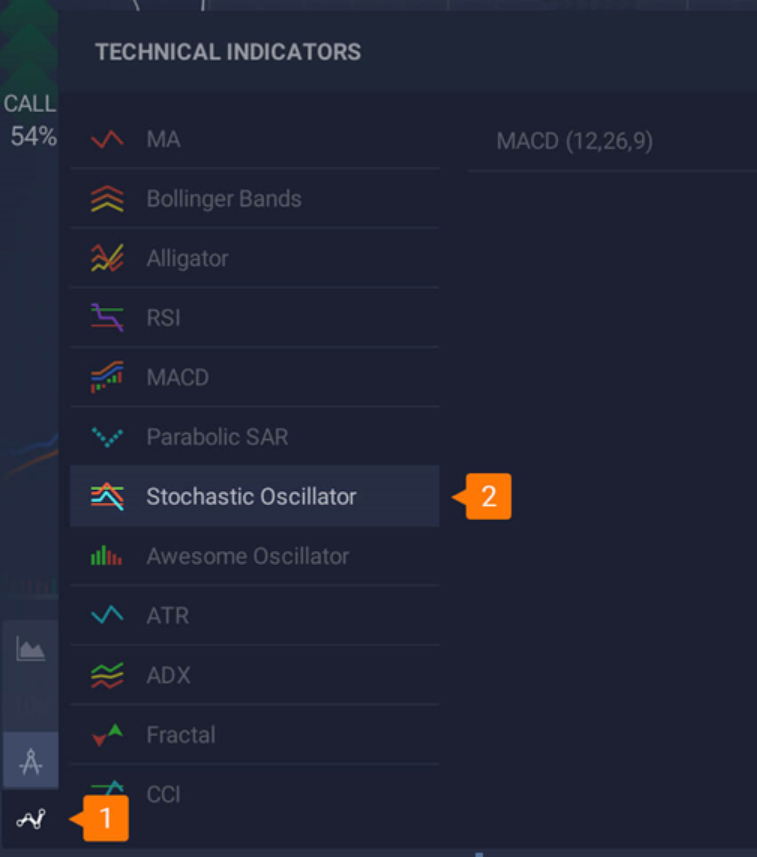
In the bottom left corner of your window, you should find and click on the “Indicators” icon. Choose the “Stochastic Indicator” from the list of indicators shown.
You can select “Set up & Apply” to change the parameters as you wish. Here you can modify %K and %D periods, overbought/oversold percentage, and lines appearance. If you are satisfied with the standard parameters, just click “Apply” to use the indicator with default settings.
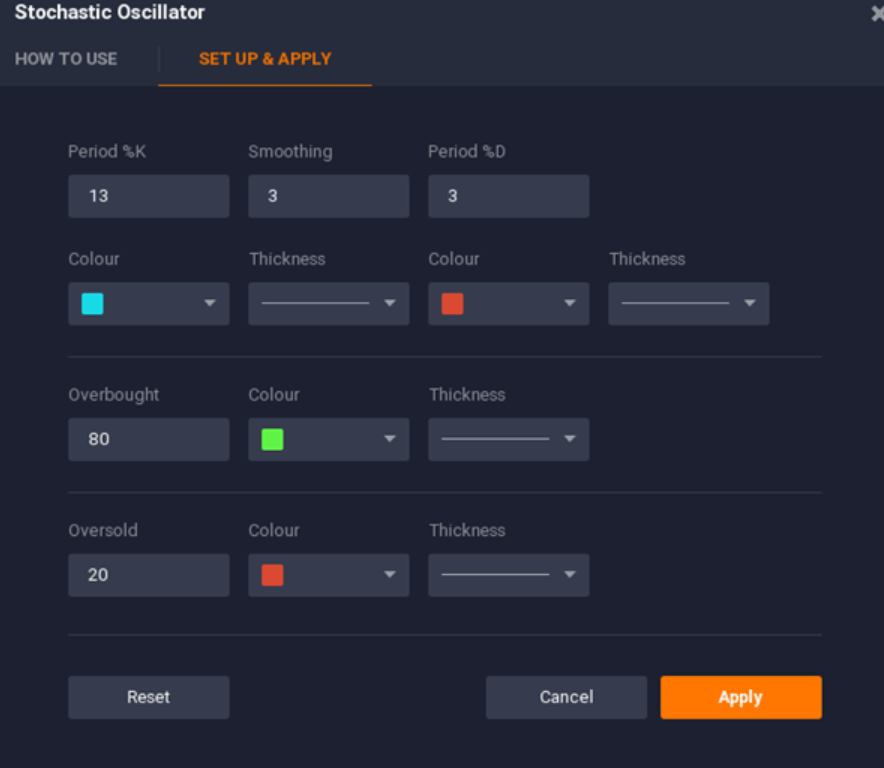
Setting up the indicator – Step two
After finishing the set up and clicking apply, your indicator is ready for use. It will show itself at the bottom of the window, under the price chart.
Using the indicator in trading
By predicting price turning points and showcasing the overbought and oversold positions, this indicator gives traders valuable information on trend movement. Establishing trend movement can be obtained in multiple ways using Stochastic Oscillator, but the two we are about to show you stand out.
1. Overbought and oversold levels
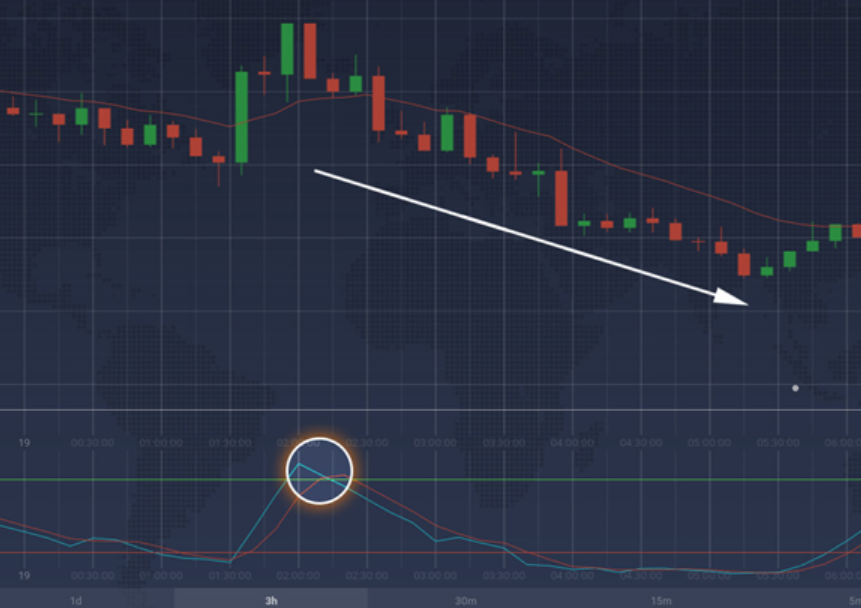
Overbought Signal
When the both moving average lines go over the overbought horizontal line, chances are that the trend will start declining. The fast moving average going under the slow moving average is another sign of a future downtrend.
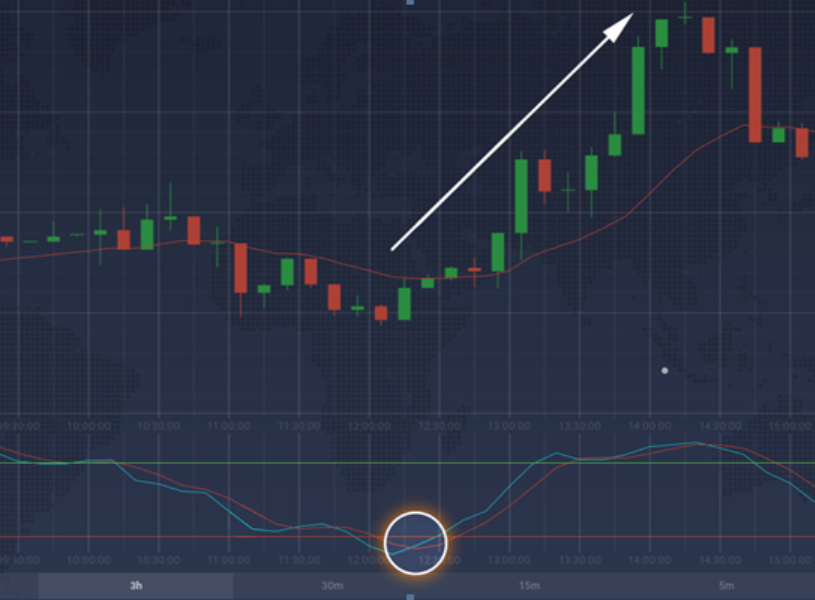
Oversold Signal
On the contrary, when the moving average lines start sitting under the oversold line, it is likely that the trend will take an upwards direction. The fast moving average line going above the slow moving average line confirms the arrival of the bullish trend.
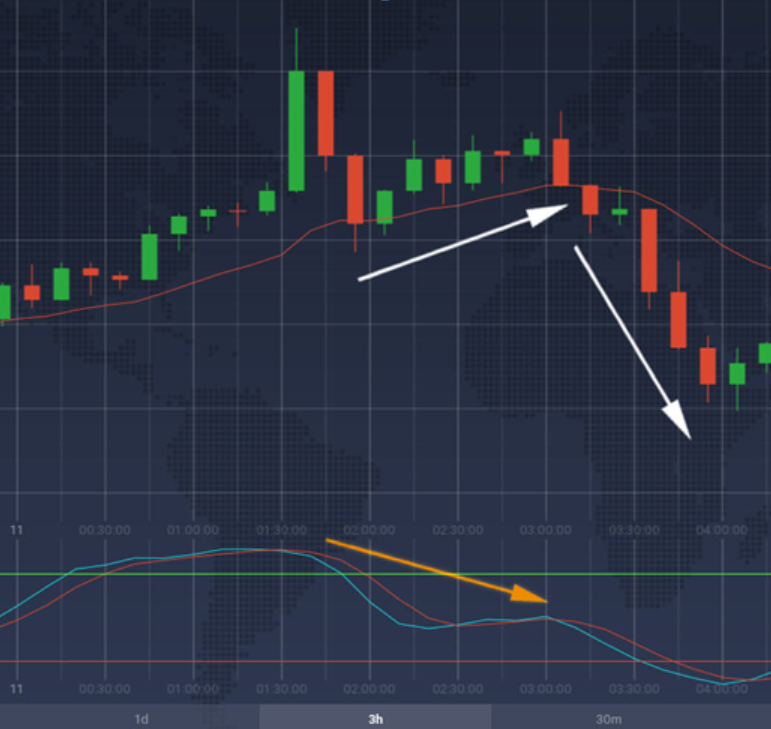
2. Divergence
Trend reversal is usually followed after the indicator and the price action start moving in opposite directions. Divergence can go both ways.
IqOption Stochastic Oscillator Conclusion
The Stochastic Oscillator is a popular and widely used trading tool. It can work in combination with other momentum indicators and trend-following indicators as well. This combining alongside careful use is advisory for the most efficient results.
Leave a Reply