What is Fibonacci Lines on IqOption?
When talking about an all-around technical analysis tool you have to mention the power and effect of Fibonacci Lines and their implementation in trading. This tool can be applied to both bullish and bearish trends, as well as all assets and time frames. Fibonacci Lines are shown on a chart as a group of horizontal lines that follow Fibonacci ratios of 23.6%, 38.2%, 50%, 61.8% and 100%. The tool is effective at establishing support and resistance levels. It works on a principle found by an Italian mathematician called Fibonacci.
How to Use Fibonacci Lines on IqOption?
Getting to understand how to implement Fibonacci Lines in trading requires the knowledge about support and resistance levels. Support and resistance levels are a concept that the price movement will stop at a certain level and soon start heading in the other direction. When the trend starts closing in on the level line, it’s expected for it to go two ways; break through or fall back. Falling back is more frequent around the retracement line.

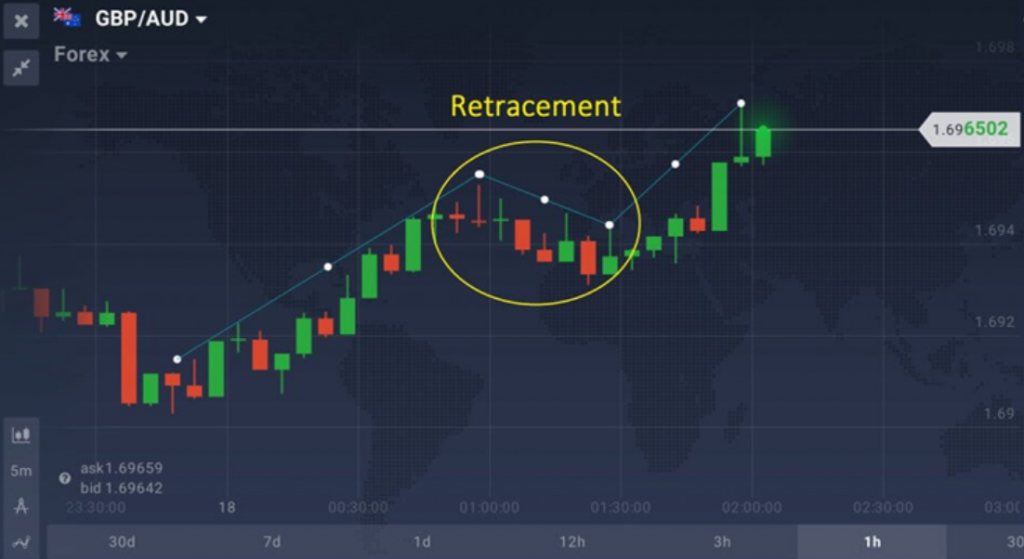
Retracement line shown in the chart.
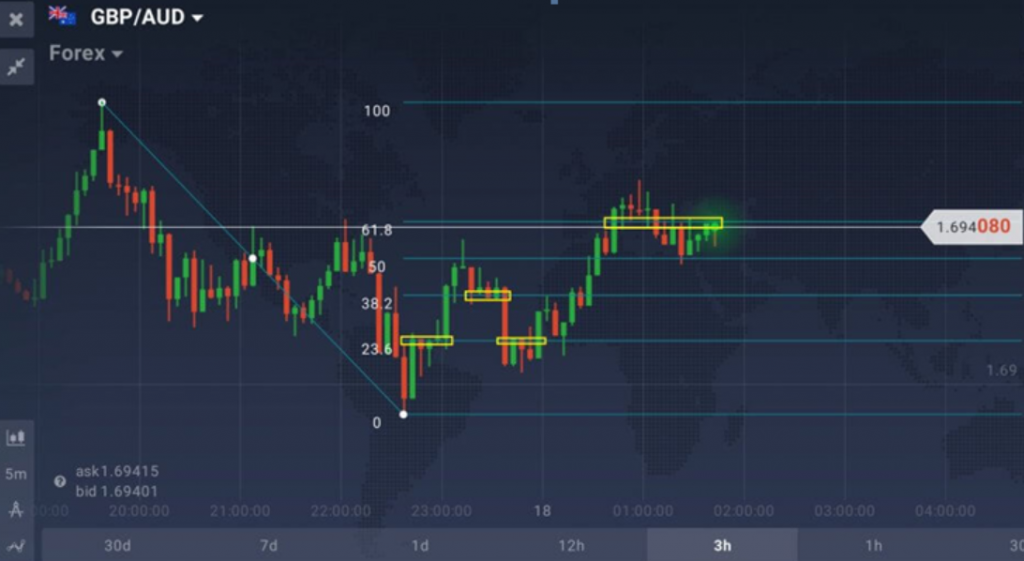
Retracement is defined as a price movement that appears for a short period going against the general trend. Fibonacci Lines are perfect at recognizing this, and they can effectively be used for establishing the favorable time for buying and or short selling. In the acts of uptrend, the tool can produce a buy signal during the fallback. In the downtrend, lines are used to show optimal short selling positions. Experts agree that 61.8 is the main retracement level, simply because the price swing possibility on this level are higher due to bigger buy/sell pressure. It is important not to mix the terms trend retracement with trend reversal, as they represent different terms. Confusing the two can have bad effects on your trading.

Notice how the price action sticks around at the Fibonacci lines (yellow fields).
It is also advised that you combine Fibonacci Lines with one of the momentum indicators (Stochastic Oscillator or MACD).
Setting Up IqOption Fibonacci Lines

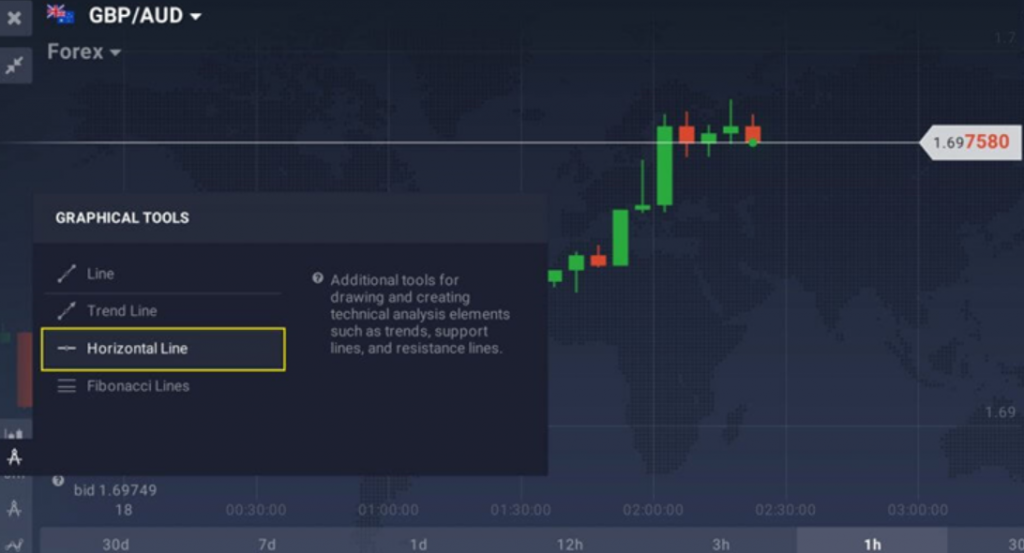
Activating Fibonacci Lines is four clicks away.
It’s not that complicated to set up Fibonacci Retracement in IQ Option platform. Go over and click on “Graphical tools” icon in the bottom left. Here you just select “Fibonacci Lines” from the list and you are good to go. Now you just need to locate the most recent swing highs and lows. For downtrends, click on the swing high and drag the cursor to the most recent swing low. And for uptrends, do it the other way around: click on the swing low and drag the cursor to the most recent swing high. Fibonacci Retracement levels will now be ready to use.
Iqoption Fibonacci Lines Conclusion
Although limited, Fibonacci Retracement is a very useful and effective graphical tool. It can help you pinpoint optimal entry and exit points during retracements. Although, sometimes support and resistance levels shown by this graphical tool are not completely reliable. Traders like to say that they constitute “areas of interest”. Using Fibonacci Lines as the only indicator is not a wise choice, but it can sure be helpful as a supportive tool in trading.
Leave a Reply