• Home
  • Trading Indicators
    • ADX Indicator
    • Alligator and Analysis
    • Fisher Transform Indicator
    • IqOption ATR Indicator
    • IqOption Awesome Oscillator
    • IqOption Bollinger Bands
    • CCI and MA
    • CCI indicator
    • Center of Gravity Indicator
    • Chande Forecast Oscillator (CFO)
    • Detrended Price Oscillator Indicator
    • Elliott wave principle
    • Fibonacci Lines
    • IqOption MACD Indicator
    • IqOption Indicator Moving Average
    • Parabolic SAR Indicator
    • Parabolic Stop and Reverse
    • RSI Indicator
    • RWI indicator
    • Stochastic lines
    • Stochastic Oscillator
    • Stochastic Power Trading
    • Support & Resistance
    • Technical Analysis
  • Trading Education
  • Make Deposit
  • Registration
  • Log In
  • Withdraw
  • Reviews
    • About Broker
    • Android App
    • iOS App
    • IQBroker
    • IqOption Affiliate program
    • Iq Option Careers & Work
    • IqOption in India
    • IQ Option Facebook
    • IQ Option Instagram
    • Is IQ Options safe?
    • Is Scam?
    • IqOption Mobile Application
    • Problem with Iqoption
    • Trading Features
    • Tips
    • Twitter
    • Why demo account?
    • USA traders
    • Vimeo
    • YouTube
  • F.A.Q
    • Account Verification
    • Android APK
    • Blocked and Closed account
    • Can i get profit?
    • Client Categorisation
    • Contacts & Support
    • Download
    • General questions
    • How to open demo
    • IQ Option Trading
    • IQ Option Wikipedia
    • Logout
    • Tournaments
    • IqOption Traders Account
    • Trading Fees
    • Withdrawal Process
  • Home
  • Trading Indicators
    • ADX Indicator
    • Alligator and Analysis
    • Fisher Transform Indicator
    • IqOption ATR Indicator
    • IqOption Awesome Oscillator
    • IqOption Bollinger Bands
    • CCI and MA
    • CCI indicator
    • Center of Gravity Indicator
    • Chande Forecast Oscillator (CFO)
    • Detrended Price Oscillator Indicator
    • Elliott wave principle
    • Fibonacci Lines
    • IqOption MACD Indicator
    • IqOption Indicator Moving Average
    • Parabolic SAR Indicator
    • Parabolic Stop and Reverse
    • RSI Indicator
    • RWI indicator
    • Stochastic lines
    • Stochastic Oscillator
    • Stochastic Power Trading
    • Support & Resistance
    • Technical Analysis
  • Trading Education
  • Make Deposit
  • Registration
  • Log In
  • Withdraw
  • Reviews
    • About Broker
    • Android App
    • iOS App
    • IQBroker
    • IqOption Affiliate program
    • Iq Option Careers & Work
    • IqOption in India
    • IQ Option Facebook
    • IQ Option Instagram
    • Is IQ Options safe?
    • Is Scam?
    • IqOption Mobile Application
    • Problem with Iqoption
    • Trading Features
    • Tips
    • Twitter
    • Why demo account?
    • USA traders
    • Vimeo
    • YouTube
  • F.A.Q
    • Account Verification
    • Android APK
    • Blocked and Closed account
    • Can i get profit?
    • Client Categorisation
    • Contacts & Support
    • Download
    • General questions
    • How to open demo
    • IQ Option Trading
    • IQ Option Wikipedia
    • Logout
    • Tournaments
    • IqOption Traders Account
    • Trading Fees
    • Withdrawal Process
Home » Trading Education

Trading with Williams’ %R on Iq Option


Contents

  • Trading with Williams’ %R: How to Spot Trading Opportunities?
  • How does Williams’ %R work on IqOption?
  • How to apply Williams’ %R?
  • Overbought/oversold
  • Momentum confirmations
  • Possible limitations

Trading with Williams’ %R: How to Spot Trading Opportunities?

Williams’ %R (Williams Overbought/Oversold Index or Williams Percent Range) is an easy but an effective technical analysis tool that surpass at identifying overbought and oversold levels. Intraday, daily, weekly, monthly time intervals are the best choice at working with this indicator. The Williams’ %R is an oscillator and it moves on the scale from 1 to -100, the working process of it in some way is similar to the working process of Stochastic. If you want to use Williams %R effectively, you will need to learn how it works, what it is able to do and what are the constraints.

How does Williams’ %R work on IqOption?

Williams’ %R is an oscillator-type indicator and it is alike to the Stochastic Oscillator in some ways but with the remarkable difference in their scales. The Williams Percent Range is from 1 to 100 but for the Stochastic it can vary from 1 to 100. Moreover, the Stochastic have a moving average, which is used like a source of crossover signals. 

iqoption Williams R compares the current price
Williams’ %R compares the current price to the prices over the lookback period

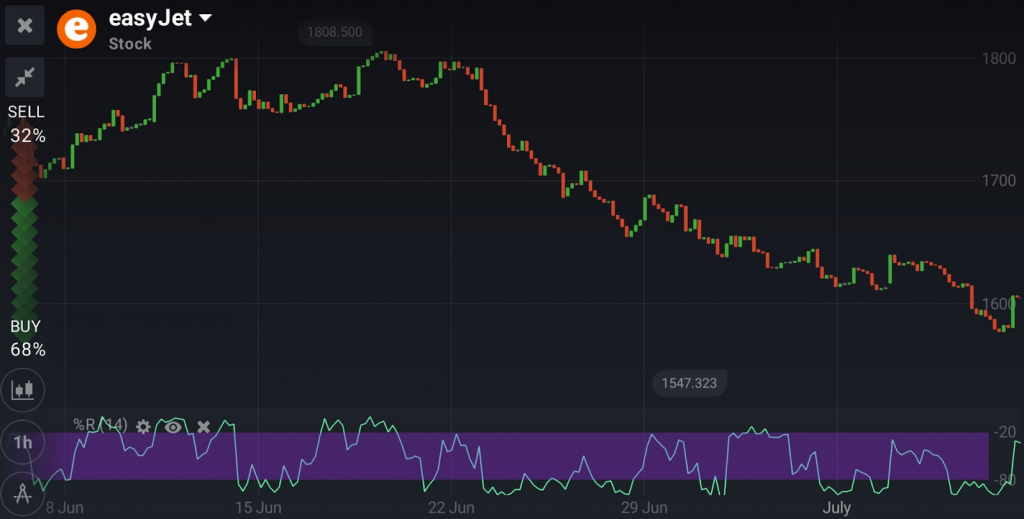
As by default the Williams’ R% uses a period which is equal to 14 candles. Therefore, the indicator will cover the period of 14 hours for a 1H graph, and 14 weeks for a 7D graph. Nevertheless, the sensitivity of the instrument can be increased or the number of false signals can be decreased.The indicator shows how the current price compares to the highest price over a set period of time.

When the indicator’s readings come close to 0, it means that the current price close to or higher than the highest price observed during the specific period. Alternatively, when the indicator gets to the -100 threshold, the current price is lower than the lowest price of the exact period. Lastly, when the readings get to the middle of the channel, the current price is equal to the average price of the lookback period.

How to apply Williams’ %R?

There are some ways to start working with Williams’ %R. This indicator is most often used to identify overbought/oversold levels, provide momentum confirmations and trade signals.

Overbought/oversold

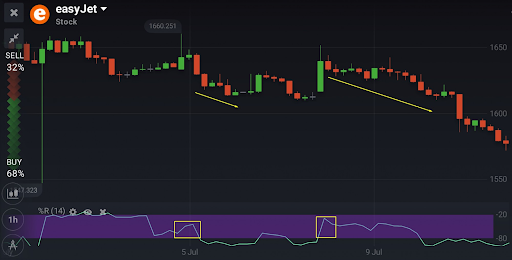
The asset is believed to be overbought the indicator is above -20. The asset is oversold when it goes down below -80. It is good that the indicator as by default will use both readings. Thus, you are not ought to adjust the settings before putting the indicator into action. However, do not let this tool fool you because of its simplicity, overbought does not necessarily mean the price is about to fall, just as oversold doesn’t always mean that the price action will shoot up.

iqoption overbought oversold levels
IqOption Overbought/oversold levels can come be useful when determining optimal entry points.

Of course, all trends are destined to reverse. But overbought/oversold levels don’t tell you when to await the reversal. Similar signals can be used to approve readings, received from other indicators. Avoid of false and late signals, however, as they are quite common when trading with a single indicator and no approvals.

Momentum confirmations

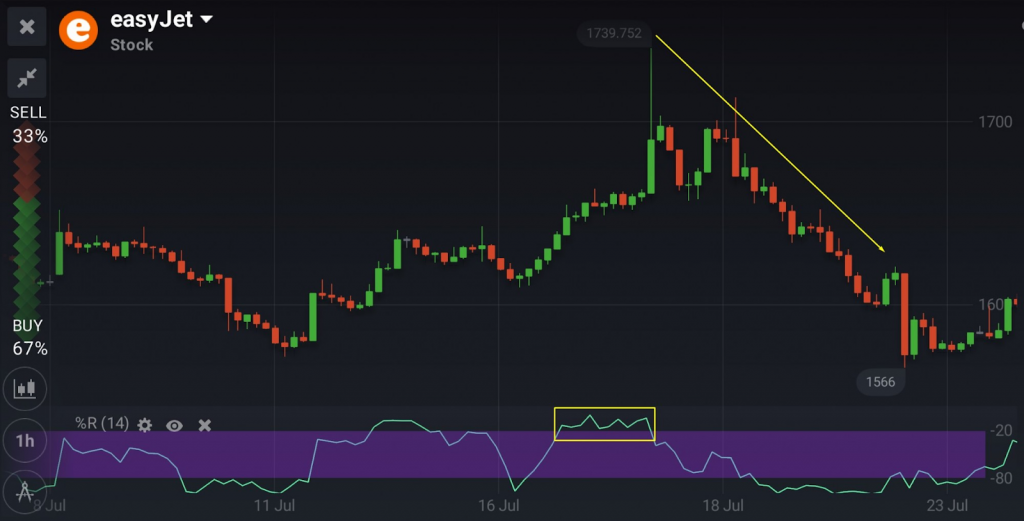
In trading, momentum is just as crucial as the direction of the trend. A strong momentum means the trend has to last some more. When the momentum becomes weaker, it can be expected to stagnate or even reverse. This kind of information is useful to any trader.

Imagine you have spotted a newborn bullish trend. If the %R reach -20 and stay above it, the current trend can be expected to last (presumably). Other way round  %R stays below, the trend might be running out of its strength and can, therefore, be expected to reverse. The same is with the negative trends. When the indicator is below -80, the trend is stronger and can be expected to last. When it gets above the -80 threshold, the reversal is feasible.

iqoption positive trend runs out of momentum before R
For two times in a row the positive trend runs out of momentum before %R could get to the overbought level

Possible limitations

Due to the fact that Williams’ R% will provide many false and late signals, it should not be used only on its own, just as many other indicators. Moreover, it is not able to provide accurate signals all the time. When working with the Williams Percent Range, some traders get out of the trend too early, losing a significant portion of potential upside. Consequently, it is possible to keep the position open as long as the price is getting overall higher (lower for short positions), disregarding the signals provided by Williams’ %R. It is really important to remember that Williams’ %R is still a trading tool, not a prepped strategy.


Read Next

5 Trading Proverbs - Timeless Wisdom for Iq Option Traders

4 Comments

Richard
2021-01-19 at 3:48 PM

Highly complex method I prefer not to use it


Reynold
2020-12-03 at 6:04 PM

R% Williamsasam itself is bad! But if you add a couple of your own indicators to it, it will be useful!


Wilkerson
2020-11-26 at 4:08 PM

This strategy should only be used in conjunction with others and as usual everything should be tested on a demo account


Vogn
2020-11-10 at 4:06 PM

Trading with Williams’ %R often misleads you


Leave a Reply

Your email address will not be published. Required fields are marked *

  • Pages

    • About us
    • Account Verification
    • ADX Indicator
    • Android APK
    • Can i get profit from Iq Option?
    • CCI and MA
    • CCI indicator
    • Center of Gravity Indicator
    • Chande Forecast Oscillator (CFO)
    • Contact us
    • Contacts & Support
    • Detrended Price Oscillator Indicator
    • Download
    • Elliott wave principle
    • Fibonacci Lines
    • Fisher Transform Iq Option Indicator
    • General questions
    • How to open demo
    • Iq Option Careers & Work
    • IQ Option Facebook
    • IQ Option Instagram
    • Iq Option iOS App
    • IQ Option Trading
    • IQ Option Wikipedia
    • IQBroker
    • IqOption – Client Categorisation
    • IqOption – Twitter
    • IqOption – YouTube
    • IqOption Affiliate program
    • IqOption Alligator and Analysis
    • IqOption Android App / Google Play
    • IqOption ATR Indicator
    • IqOption Awesome Oscillator
    • IqOption Blocked and Closed account
    • IqOption Bollinger Bands
    • IqOption in India
    • IqOption Indicator Moving Average
    • IqOption MACD Indicator
    • IqOption Make Deposit
    • IqOption Mobile Application
    • IqOption Reviews
    • IqOption Traders Account
    • IqOption Vimeo
    • Is IQ Options safe?
    • Is Scam?
    • Log In
    • Logout
    • Online Trading Broker Review
    • Parabolic SAR Indicator
    • Parabolic Stop and Reverse
    • privacy policy
    • Problem with Iqoption
    • Registration
    • RSI Indicator
    • RWI indicator
    • Search Results
    • Stochastic lines
    • Stochastic Oscillator
    • Stochastic Power Trading
    • Support & Resistance
    • Technical Analysis
    • Tips
    • Tournaments
    • Trading Features
    • Trading Fees
    • USA traders
    • Why demo account?
    • Withdraw
    • Withdrawal Process
  • Recent Posts

    • Balance of Power – Identifying Market Sentiment
    • How to Capitalize on IqOption Marijuana Stocks?
    • How to Measure Risk?
    • IqOption Beginner’s Guide
    • How to Trade a IqOption Falling Asset? Two Rules by Jeff Clark
    • What Time Frame to Trade on IqOption?
    • Improving Your Trades in 5 Simple Steps
    • What Is a Trading Journal and Why Do You Need One?
    • Highest High, Lowest Low – 2 IqOption Indicators That Are Meant for Each Other
    • Why Traders Lose with IqOption? Trading Mistakes You Don’t Want to Make
    • Psychological Line Indicator: Trading Strategy and Tips
    • Trading on IqOprion with Vortex Indicator
    • Market Sentiment – IqOption Mass Psychology for Successful Traders
    • Support and Resistance: Trading Basics Tutorial
    • What Kind of Trader Are You?
    • How to Trade with Parabolic SAR in the Most Effective Way
    • Alligator and Fractals: a Powerful Combination of Technical Indicators
    • 6 Things Every Trader Should Know
    • A Trading Strategy for Everyone – The Bladerunner
    • Why You Should Keep a Trading Journal
    • How to open a trading position automatically
    • Guide to the Bearish Engulfing Candlestick Pattern
    • Why won’t You Make Money Trading Options on IQ Option?
    • Ichimoku Cloud: How to Use Indicator in Trading?
    • Master Stop-Loss and Take-Profit on IqOption Feature
    • 8 Risk Management Tips from the World’s Top Traders
    • Financial Crisis & Trading on IqOption
    • Easy Way to Open Deals on IqOption Automatically
    • Developing a Trading Strategy of Your Own
    • Commodity Channel Index (CCI)
    • Iq Option review
    • Relative Strength Index (RSI) in IqOption
    • Business and Trading
    • John Murphys Laws of Technical Trading
    • Bollinger Bands Width & Unique Volatility Indicator
    • Elder Impulse System
    • Trading with a Multiplier
    • Fundamental vs Technical. What Analysis Type to Choose on Iq Option?
    • Using Stochastic Oscillator in Trading
    • 5 Day Trading Tips
    • Nasty Trading Mistakes That You Probably Make on Iq Option
    • What to do when the market is flat on Iq Option?
    • Trading on Iq Option with Alligator – a trend-craving carnivore
    • Awesome Iq Option Platform Features You’ve Probably Never Heard Of
    • Indicator Templates – Apply All Favorite Iq Option Indicators in 2 Clicks
    • Five Don’ts of Trading — Keep These Things Away with Iq Option
    • Technical Analysis. How Does It Work on Iq Option?
    • Schaff Trend Cycle — Indicator Tutorial on Iq Option
    • Customizing the Iq Option Platform for Optimal Trading Experience
    • Trading with Iq Option QStick Indicator
    • Trading Psychology: 5 Tips to Improve Discipline on Iq Option
    • What Indicators to Use for Iq Option Day Trading?
    • Iq Option Risk Management Basics: The 2% Rule
    • 5 Trading Proverbs – Timeless Wisdom for Iq Option Traders
    • Trading with Williams’ %R on Iq Option
    • Strangle plan Volatility of the Tame Market and Classic Options
    • Trading On News with Iq Option broker
    • Iq Option Trading Education
    • Options Types on Iq Option
    • FX Options
    • Iq Option Digital Options
    • Classic Options
    • Cryptocurrency on Iq Option
    • About Iq Option Binary Options
    • Earning and Investing in Iq Option
    • Traits Successful Iq Option Traders

  • Search


  • Home
  • About us
  • Contact us
It's not an official website of IQ Option. This material is not intended for viewers from EEA countries. Binary options are not promoted or sold to retail EEA traders. © Copyright iqoptions.net - “General Risk Warning: The financial products offered by the company carry a high level of risk and can result in the loss of all your funds. You should never invest money that you cannot afford to lose”
Press enter/return to begin your search