• Home
  • Trading Indicators
    • ADX Indicator
    • Alligator and Analysis
    • Fisher Transform Indicator
    • IqOption ATR Indicator
    • IqOption Awesome Oscillator
    • IqOption Bollinger Bands
    • CCI and MA
    • CCI indicator
    • Center of Gravity Indicator
    • Chande Forecast Oscillator (CFO)
    • Detrended Price Oscillator Indicator
    • Elliott wave principle
    • Fibonacci Lines
    • IqOption MACD Indicator
    • IqOption Indicator Moving Average
    • Parabolic SAR Indicator
    • Parabolic Stop and Reverse
    • RSI Indicator
    • RWI indicator
    • Stochastic lines
    • Stochastic Oscillator
    • Stochastic Power Trading
    • Support & Resistance
    • Technical Analysis
  • Trading Education
  • Make Deposit
  • Registration
  • Log In
  • Withdraw
  • Reviews
    • About Broker
    • Android App
    • iOS App
    • IQBroker
    • IqOption Affiliate program
    • Iq Option Careers & Work
    • IqOption in India
    • IQ Option Facebook
    • IQ Option Instagram
    • Is IQ Options safe?
    • Is Scam?
    • IqOption Mobile Application
    • Problem with Iqoption
    • Trading Features
    • Tips
    • Twitter
    • Why demo account?
    • USA traders
    • Vimeo
    • YouTube
  • F.A.Q
    • Account Verification
    • Android APK
    • Blocked and Closed account
    • Can i get profit?
    • Client Categorisation
    • Contacts & Support
    • Download
    • General questions
    • How to open demo
    • IQ Option Trading
    • IQ Option Wikipedia
    • Logout
    • Tournaments
    • IqOption Traders Account
    • Trading Fees
    • Withdrawal Process
  • Home
  • Trading Indicators
    • ADX Indicator
    • Alligator and Analysis
    • Fisher Transform Indicator
    • IqOption ATR Indicator
    • IqOption Awesome Oscillator
    • IqOption Bollinger Bands
    • CCI and MA
    • CCI indicator
    • Center of Gravity Indicator
    • Chande Forecast Oscillator (CFO)
    • Detrended Price Oscillator Indicator
    • Elliott wave principle
    • Fibonacci Lines
    • IqOption MACD Indicator
    • IqOption Indicator Moving Average
    • Parabolic SAR Indicator
    • Parabolic Stop and Reverse
    • RSI Indicator
    • RWI indicator
    • Stochastic lines
    • Stochastic Oscillator
    • Stochastic Power Trading
    • Support & Resistance
    • Technical Analysis
  • Trading Education
  • Make Deposit
  • Registration
  • Log In
  • Withdraw
  • Reviews
    • About Broker
    • Android App
    • iOS App
    • IQBroker
    • IqOption Affiliate program
    • Iq Option Careers & Work
    • IqOption in India
    • IQ Option Facebook
    • IQ Option Instagram
    • Is IQ Options safe?
    • Is Scam?
    • IqOption Mobile Application
    • Problem with Iqoption
    • Trading Features
    • Tips
    • Twitter
    • Why demo account?
    • USA traders
    • Vimeo
    • YouTube
  • F.A.Q
    • Account Verification
    • Android APK
    • Blocked and Closed account
    • Can i get profit?
    • Client Categorisation
    • Contacts & Support
    • Download
    • General questions
    • How to open demo
    • IQ Option Trading
    • IQ Option Wikipedia
    • Logout
    • Tournaments
    • IqOption Traders Account
    • Trading Fees
    • Withdrawal Process
Home » Trading Education

How to Trade with Parabolic SAR in the Most Effective Way


Parabolic SAR on IqOption is a technical analysis indicator created by Welles J. Wilder. It was first mentioned in Wilder’s book “New Concepts in Technical Trading Systems” in 1978. SAR means “stop and reverse”, it tracks the price action over time. The indicator is placed lower than the price when the prices increase, and higher than the price when the prices decrease. Wilder called this indicator the “Parabolic Time/Price System.”

The indicator was created with the purpose of informing the trader about probable trend changes. Although Parabolic SAR is a one of a kind indicator with high practical potential,  it have to be used together with other indicators in order to reach the maximum accuracy.

Contents

  • How does Parabolic SAR work?
  • Settings for intraday trading
  • How to use Parabolic SAR
  • Parabolic SAR + SMA
  • Predicting bullish trend
  • Predicting the bearish trend

How does Parabolic SAR work?

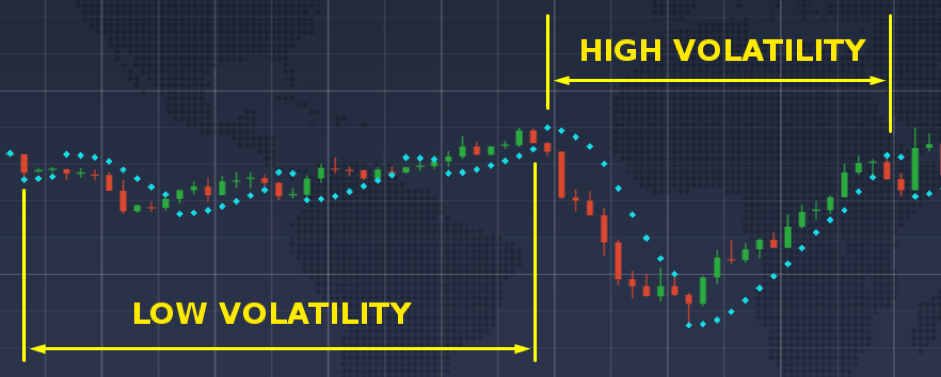
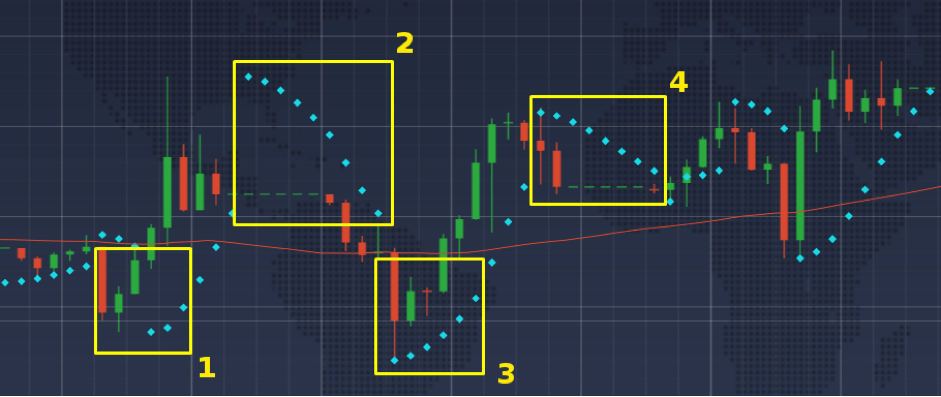
The concept of the indicator is pretty simple. If the price has an intersection with one of Parabolic SAR dots, the indicator is awaited to reverse and occur on the opposite side of the price line. Suchlike behavior may be an indication of a forthcoming trend reversal or at least a trend slowdown.

Parabolic SAR may forecast trend reversals

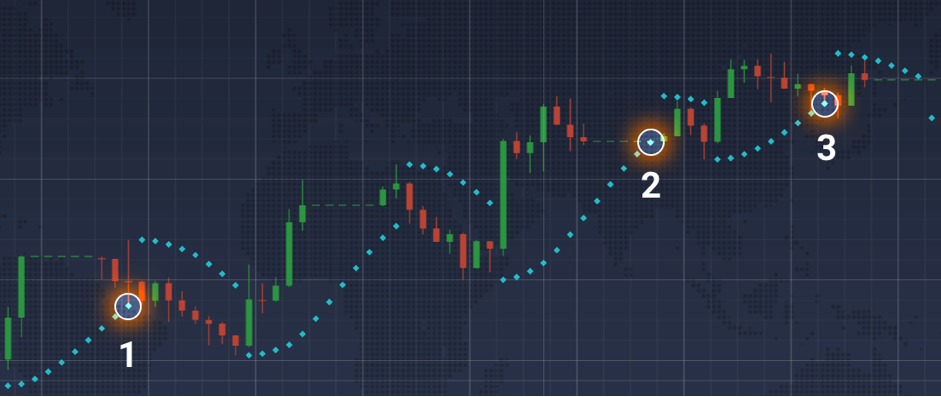
It may be seen in the picture above that if Parabolic SAR touches the price, the trend has a reversal. This risk-following indicator may be applied in order to evaluate the best entry/exit points, forecast the trend direction and predict behavior of the price action in the future.

Settings for intraday trading

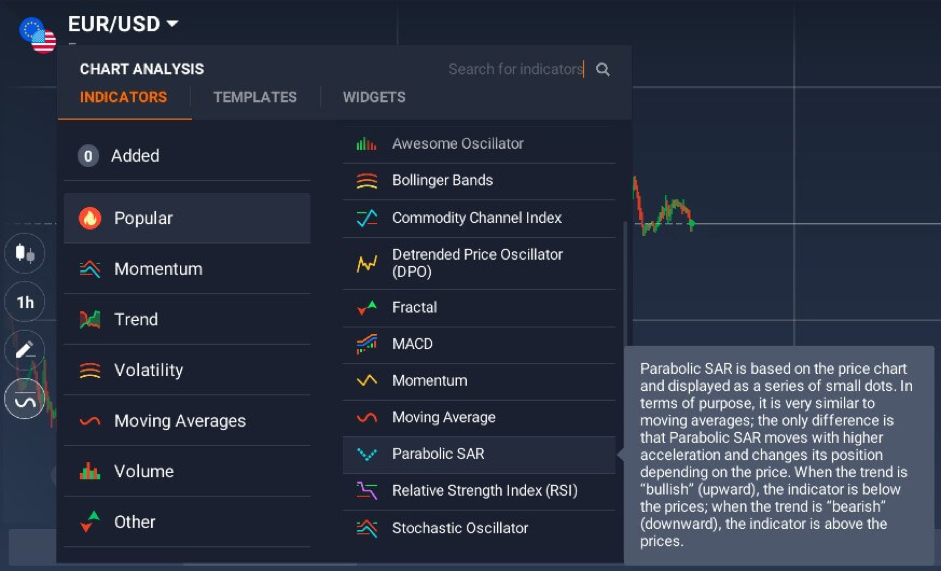
For the purpose of applying Parabolic SAR technical analysis indicator, follow these steps:

1. Click on the “Indicators” button in the bottom left corner of the trade room

2. Go to the “Popular” tab

3. Select Parabolic SAR from the list of available options

Settings for intraday trading

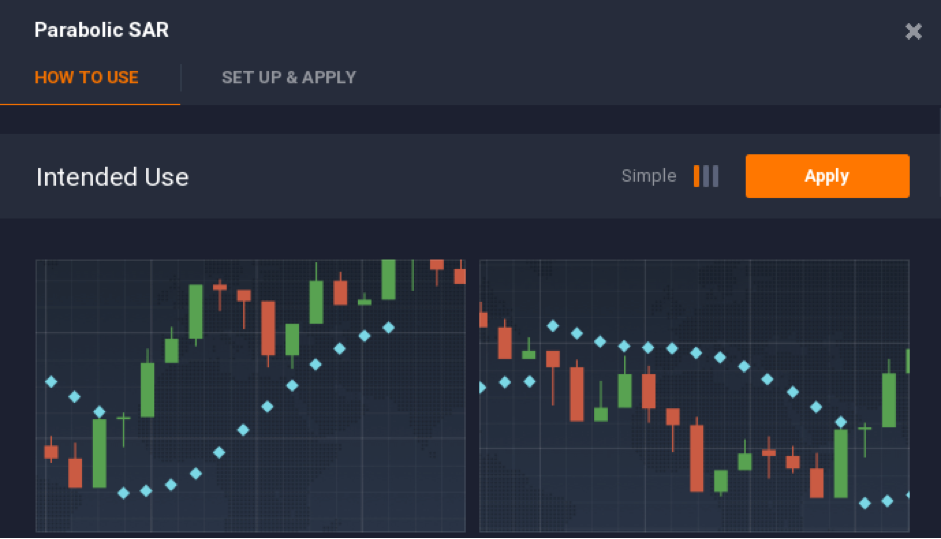
4. Click “Apply” if you want to use the indicator with default settings.

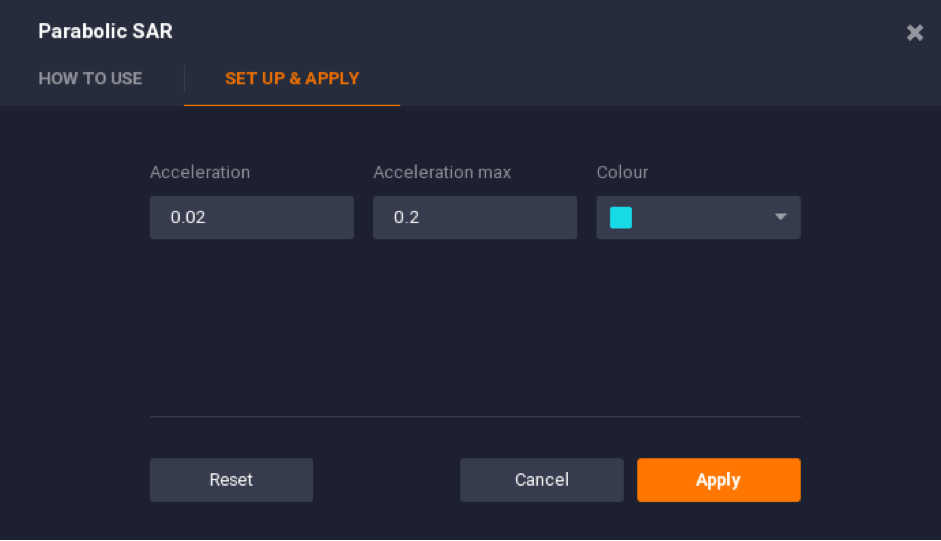
5. Or switch to the “Set Up & Apply” tab and adjust the indicator in accordance with your preferences.

Switch to the “Set Up & Apply” tab

Traders may configure two technical settings in the “Set Up & Apply” tab and these are acceleration and acceleration max. If you increase the numbers, you are able to make the indicator more sensitive, but at the same time you will lower its accuracy.

The opposite effect may be achieved by decreasing the values of acceleration and acceleration max: the indicator will turn to be less sensitive but will as well give less false signals. It is highly important to find the correct balance between accuracy and sensitivity, if you are interested in applying Parabolic SAR in intraday trading.

Adjusting the acceleration and acceleration max settings

How to use Parabolic SAR

In accordance with Welles J. Wilder, the indicator have to be applied only throughout powerful trends, which commonly don’t exceed 30% of the time. The application of Parabolic SAR on short time periods and throughout the sideways movement is not recommended because the indicator loses its forecasting power and may return false signals.

Experienced traders regularly use Parabolic SAR together with other indicators. One of the probable combinations — Parabolic SAR and Simple Moving Average — and its practical uses are explained below. It is recommended to double-check Parabolic SAR signals applying other indicators.

Parabolic SAR + SMA

The combination of these two technical analysis instruments is famous among professional traders. Parabolic SAR (acceleration = 0.04, acceleration max = 0.4) and the SMA (period = 55) are applied together to approve each other’s signals. If you use both indicators simultaneously, you may expect for the following signals to occur:

Predicting bullish trend

If the price is lower than the SMA and Parabolic SAR shows positive movement, the trend may be awaited to turn into bullish.

Predicting the bearish trend

Forecasting trends with Parabolic SAR and the SMA

If the price is higher than the SMA and Parabolic SAR shows negative movement, the trend may be awaited to turn into bearish.

Also note that any indicator is not able to guarantee precise signals all the time. Sometimes all indicators will give false signals, and Parabolic SAR too. You, as a trader, have to separate true signals from false ones on your own.


Read Next

What Kind of Trader Are You?

1 Comment

Gilbert
2021-01-19 at 6:07 PM

This is very difficult to understand, I prefer to use simpler analysis methods


Leave a Reply

Your email address will not be published. Required fields are marked *

  • Pages

    • About us
    • Account Verification
    • ADX Indicator
    • Android APK
    • Can i get profit from Iq Option?
    • CCI and MA
    • CCI indicator
    • Center of Gravity Indicator
    • Chande Forecast Oscillator (CFO)
    • Contact us
    • Contacts & Support
    • Detrended Price Oscillator Indicator
    • Download
    • Elliott wave principle
    • Fibonacci Lines
    • Fisher Transform Iq Option Indicator
    • General questions
    • How to open demo
    • Iq Option Careers & Work
    • IQ Option Facebook
    • IQ Option Instagram
    • Iq Option iOS App
    • IQ Option Trading
    • IQ Option Wikipedia
    • IQBroker
    • IqOption – Client Categorisation
    • IqOption – Twitter
    • IqOption – YouTube
    • IqOption Affiliate program
    • IqOption Alligator and Analysis
    • IqOption Android App / Google Play
    • IqOption ATR Indicator
    • IqOption Awesome Oscillator
    • IqOption Blocked and Closed account
    • IqOption Bollinger Bands
    • IqOption in India
    • IqOption Indicator Moving Average
    • IqOption MACD Indicator
    • IqOption Make Deposit
    • IqOption Mobile Application
    • IqOption Reviews
    • IqOption Traders Account
    • IqOption Vimeo
    • Is IQ Options safe?
    • Is Scam?
    • Log In
    • Logout
    • Online Trading Broker Review
    • Parabolic SAR Indicator
    • Parabolic Stop and Reverse
    • privacy policy
    • Problem with Iqoption
    • Registration
    • RSI Indicator
    • RWI indicator
    • Search Results
    • Stochastic lines
    • Stochastic Oscillator
    • Stochastic Power Trading
    • Support & Resistance
    • Technical Analysis
    • Tips
    • Tournaments
    • Trading Features
    • Trading Fees
    • USA traders
    • Why demo account?
    • Withdraw
    • Withdrawal Process
  • Recent Posts

    • Balance of Power – Identifying Market Sentiment
    • How to Capitalize on IqOption Marijuana Stocks?
    • How to Measure Risk?
    • IqOption Beginner’s Guide
    • How to Trade a IqOption Falling Asset? Two Rules by Jeff Clark
    • What Time Frame to Trade on IqOption?
    • Improving Your Trades in 5 Simple Steps
    • What Is a Trading Journal and Why Do You Need One?
    • Highest High, Lowest Low – 2 IqOption Indicators That Are Meant for Each Other
    • Why Traders Lose with IqOption? Trading Mistakes You Don’t Want to Make
    • Psychological Line Indicator: Trading Strategy and Tips
    • Trading on IqOprion with Vortex Indicator
    • Market Sentiment – IqOption Mass Psychology for Successful Traders
    • Support and Resistance: Trading Basics Tutorial
    • What Kind of Trader Are You?
    • How to Trade with Parabolic SAR in the Most Effective Way
    • Alligator and Fractals: a Powerful Combination of Technical Indicators
    • 6 Things Every Trader Should Know
    • A Trading Strategy for Everyone – The Bladerunner
    • Why You Should Keep a Trading Journal
    • How to open a trading position automatically
    • Guide to the Bearish Engulfing Candlestick Pattern
    • Why won’t You Make Money Trading Options on IQ Option?
    • Ichimoku Cloud: How to Use Indicator in Trading?
    • Master Stop-Loss and Take-Profit on IqOption Feature
    • 8 Risk Management Tips from the World’s Top Traders
    • Financial Crisis & Trading on IqOption
    • Easy Way to Open Deals on IqOption Automatically
    • Developing a Trading Strategy of Your Own
    • Commodity Channel Index (CCI)
    • Iq Option review
    • Relative Strength Index (RSI) in IqOption
    • Business and Trading
    • John Murphys Laws of Technical Trading
    • Bollinger Bands Width & Unique Volatility Indicator
    • Elder Impulse System
    • Trading with a Multiplier
    • Fundamental vs Technical. What Analysis Type to Choose on Iq Option?
    • Using Stochastic Oscillator in Trading
    • 5 Day Trading Tips
    • Nasty Trading Mistakes That You Probably Make on Iq Option
    • What to do when the market is flat on Iq Option?
    • Trading on Iq Option with Alligator – a trend-craving carnivore
    • Awesome Iq Option Platform Features You’ve Probably Never Heard Of
    • Indicator Templates – Apply All Favorite Iq Option Indicators in 2 Clicks
    • Five Don’ts of Trading — Keep These Things Away with Iq Option
    • Technical Analysis. How Does It Work on Iq Option?
    • Schaff Trend Cycle — Indicator Tutorial on Iq Option
    • Customizing the Iq Option Platform for Optimal Trading Experience
    • Trading with Iq Option QStick Indicator
    • Trading Psychology: 5 Tips to Improve Discipline on Iq Option
    • What Indicators to Use for Iq Option Day Trading?
    • Iq Option Risk Management Basics: The 2% Rule
    • 5 Trading Proverbs – Timeless Wisdom for Iq Option Traders
    • Trading with Williams’ %R on Iq Option
    • Strangle plan Volatility of the Tame Market and Classic Options
    • Trading On News with Iq Option broker
    • Iq Option Trading Education
    • Options Types on Iq Option
    • FX Options
    • Iq Option Digital Options
    • Classic Options
    • Cryptocurrency on Iq Option
    • About Iq Option Binary Options
    • Earning and Investing in Iq Option
    • Traits Successful Iq Option Traders

  • Search


  • Home
  • About us
  • Contact us
It's not an official website of IQ Option. This material is not intended for viewers from EEA countries. Binary options are not promoted or sold to retail EEA traders. © Copyright iqoptions.net - “General Risk Warning: The financial products offered by the company carry a high level of risk and can result in the loss of all your funds. You should never invest money that you cannot afford to lose”
Press enter/return to begin your search