Powerful Fusion of Technical Analysis Tools on Iq Option
Let us introduce you to one of the best possible merge of technical analysis tools. Being used together, Alligator and Fractals can provide pinpoint information and are very accurate at forecasting future trends. The fact that they can be applied on any asset or time frame, make them one of the most widely used combination of indicators.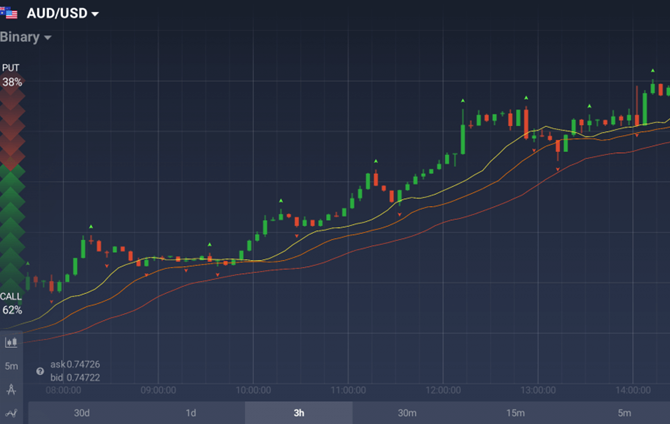
The Alligator and the Fractals overlaid on the price chart. The name for The Alligator technical analysis tool comes from its appearance on the price chart. Three overlaid lines should act for the jaw, the teeth and the lips of the alligator. This indicator is used to predict a trend and its direction in the future. For the most efficient use of the Alligator, this indicator should be combined with its oscillator-type indicator ally, especially the Fractals. The Fractals can be defined as repeated patterns that can predict turnarounds in big price movements. The credit for introducing these indicators goes to Bill Williams, famous American trader and the writer of many books on market psychology. Alongside Alligator and Fractals, he developed and put to use many other technical analysis tools like Market Facilitation Index, Gator Oscillator, Accelerator/Decelerator Oscillator, and others.
How does Iqoption Alligator indicator work?
Three smoothed moving averages represent the Alligator indicator with Fibonacci sequence numbers of 5, 8, and 13, representing periods. Each line has a particular period shift.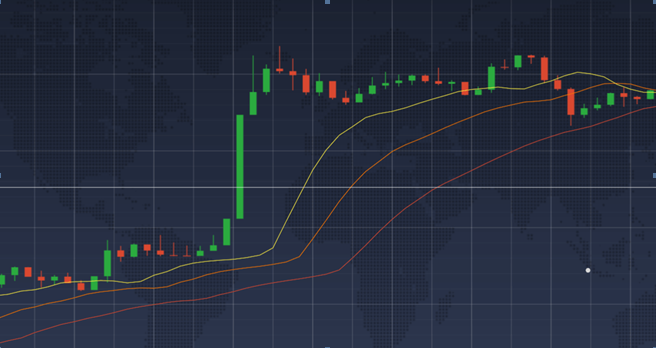
The Alligator indicator overlaid on a price chart. 1) Red line (the jaw) is a 13-period SMA (Simple Moving Average), moved into the future by 8 bars; 2) Orange line (the teeth) is an 8-period SMA, moved into the future by 5 bars; 3) Yellow line (the lips) is a 5-period SMA, moved into the future by 3 bars. The fully understand why this indicator is called the Alligator, we will use some analogies on how to follow up the indicator’s operation. Alligator’s closed mouth (all 3 lines being close to each other) represents sideways trends. Making new deals is usually avoided in this period. The longer the mouth is closed, bigger the chance it is for it to open. Long sideways trends are usually intersected with strong bullish or bearish periods. After the trend takes shape, three lines start moving away from each other, representing the open mouth of the animal. The wider the lines move from each other, the stronger the trend. When the alligator is “full” the lines start narrowing in again and move horizontally.
The iqoption Fractals Indicator
The Fractals work to present the upcoming investing opportunities to traders. By identifying emerging trends, the Fractals come in the form of two turning points: 1) A bearish turning point is shown when the highest high is surrounded by two lower highs beside it.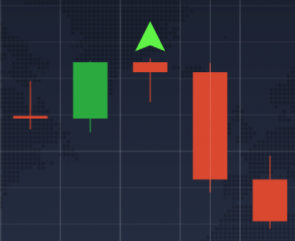
Bearish signal provided by the Fractals indicator. 2) A bullish turning point is opposite. It occurs when the lowest low is surrounded by higher lows on each side.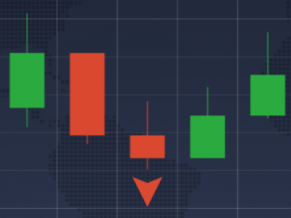
Setting up the indicators on iqoption
It’s pretty easy setting these indicators in the IQ Option trading platform. You just need to click on the “Indicators” icon that is placed in the lower left corner of your window. Here, you can find all the possible indicators. Click on the “Alligator” indicator from the list to select it.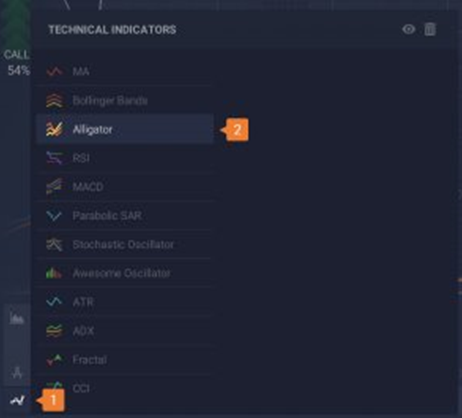
Setting up the Alligator indicator – Step one. On the next window you can click on “Apply” right away to use it with default settings. Your indicator will now be ready to use.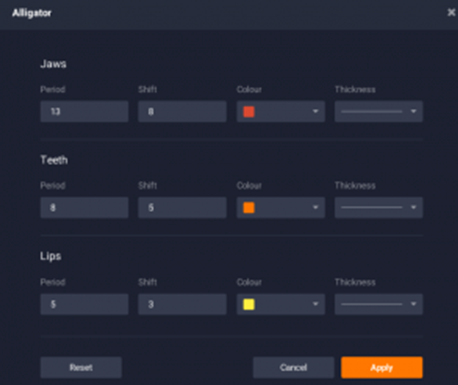
Setting up the Alligator indicator – Step two. Activating the Fractals indicator, use the same steps as for the Alligator. In the lower left corner click “Indicators”, then select “Fractals” from the list.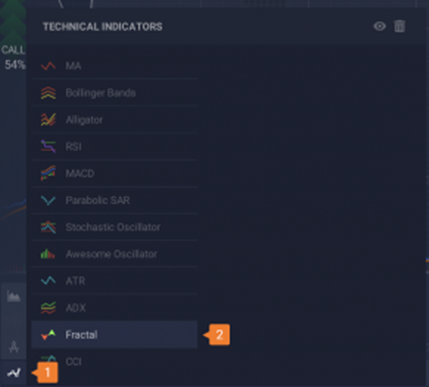
Setting up the Fractals indicator – Step one. To use the indicator without changing any settings, just click “Apply”. Your indicator will now be ready for use.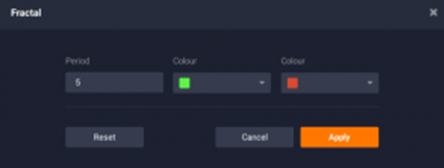
Setting up the Fractals indicator – Step two
How to apply in iqoption trading?
Although Fractals and Alligator indicators can work and be used on their own, using both of them together maxes out their efficiency and predictability. Their author agrees to this statement as well. Reading the buy and sell signals of Fractals indicator center around the Alligator’s teeth (orange line). Valid buy signals are considered when Fractals indicators are bellow this line, and all sell signals is should of course be above it.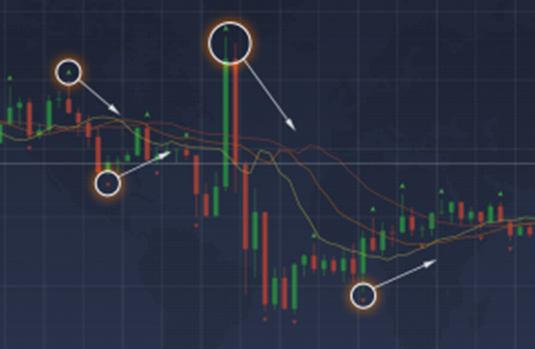
Using the Alligator and the Fractals together, there are strong chances of having accurate sell or buy signals.
Short reflection on the indicators.
1. Being the indicators that follow trend, the Alligator and the Fractals are falling behind the actual market. 2. Increasing the period is likely to boost the accuracy of both indicators. The number of generated signals will, however, decrease. 3. Checking the signals on different time frames should max out the predictive potential. 4. The Fractals and the Alligator are most efficient when used together. Using them each on their own can produce high-risk situations.
IqOption.com – “Alligator” Technical Analysis Indicator
The Alligator represents a tool for technical analysis, which consists of three major lines plotted on a chart with pricing. The lines basically represent the teeth, the jaw and the lips of the alligator. This indicator is applied for determining the overall trend as well as predict its direction in future. The Alligator, once combined with an oscillator type of indicator, demonstrates better performance. This type of indicator was originally introduced by Bill Williams in his book “New Trading Dimensions” dated in 1995. This indicator’s main purpose is to demonstrate the trends of emerging market and determine optimal points for entry. It can be used for any asset and time frame. The Alligator has already managed to turn into a core indicator for most trading platforms. Bill Williams mentions that the Alligator represents three “balance lines” combination. Each line represents a Simple Moving Average variation, which is being shifted ahead of the current price in market.
Performance basis of iqoption “Alligator”
Three smoothed moving averages with periods of five, eight and 13, which are actually Fibonacci numbers, are combined in the Alligator indicator. Each line is shifted for a certain time period ahead, which is dependent both on the long- or short-term orientation related to that line in particular.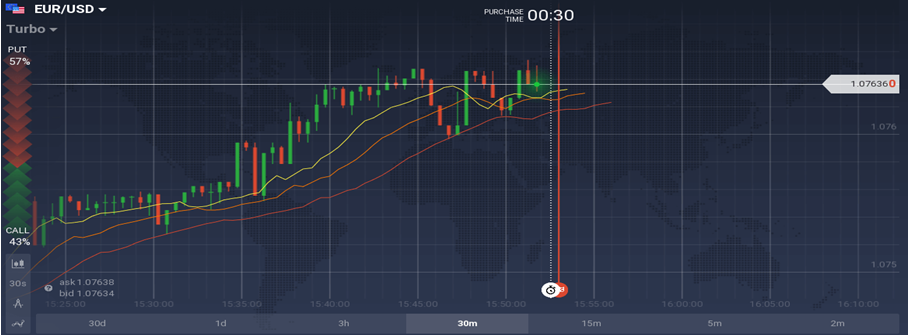
The Alligator indicator plotted on the price chart of EUR/USD
1) The Alligator’s Jaw (colored with red) represents a 13-period SMA, which is moved by 8 bars to the future;
2) The Alligator’s Teeth (colored with orange) represents an 8-period SMA, which is moved by 5 bars to the future;
3) The Alligator’s Lips (colored with yellow) represents a 5-period SMA, which moved by 3 bars to the future.
Beast in the real life
The Alligator indicator is an animal that craves for trends and it imitates successfully the real-life data. Sideways trends get marked with a closed mouth of an alligator, i.e. all the three lines move towards each other and intersect occasionally. When the alligator is asleep, it is a signal to the most of careful traders to avoid making any new deals. The longer is the waiting time of Alligator, the hungrier it becomes. Likewise, long sideways trends periods get interspersed with other strong bearish/bullish periods, and the Alligator is really strong at catching those moments. Once the trend starts taking a shape, the animal opens mouth and all the basic lines move apart farther. Hence, the stronger the trend gets, the wider is the alligator’s open mouth. When the alligator is full, it returns to rest and the lines start becoming horizontal and focusing in a corridor that is narrow.
Preparing and adjusting the indicator on iqoption platform
To enable the Alligator indicator for the trading platform IQ Option, all you need is to click on the button named “Indicators”, which is located at the lower left corner of your screen. After that select “Alligator” option in the list of offered indicators.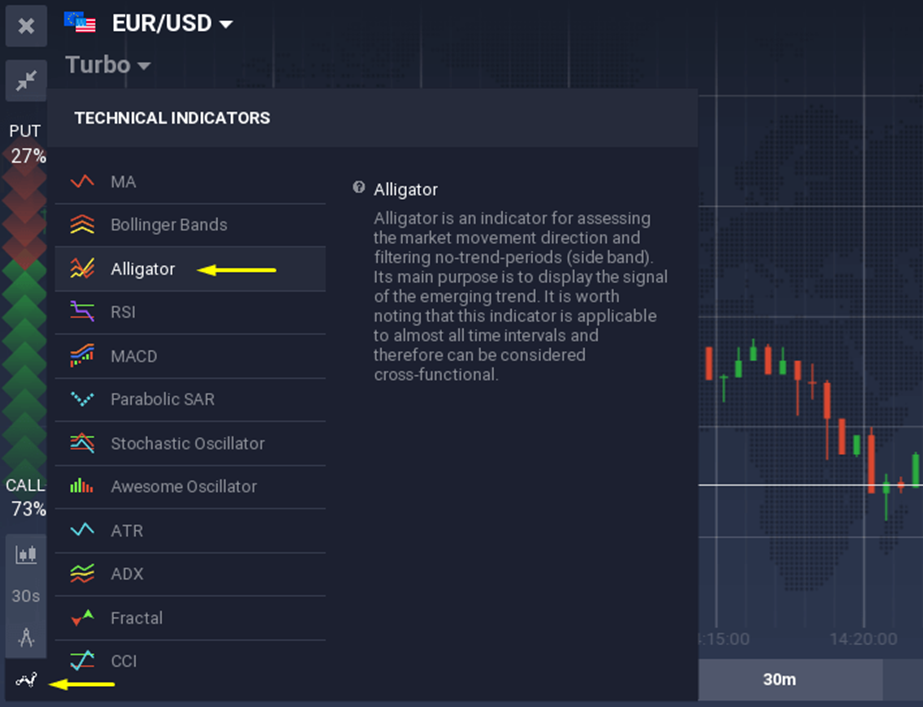
Open the indicators tab and select the Alligator from the list
Afterwards, click the button “Apply” without altering any of the settings. Then the Alligator graph will appear and overlay the price chart.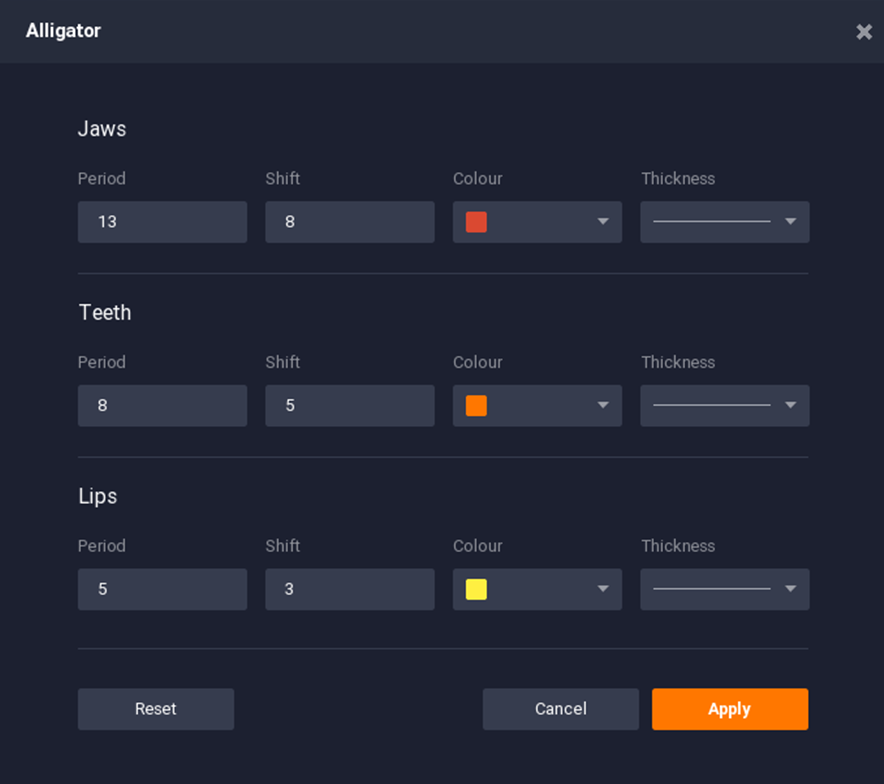
Select “Apply” from the settings screen of the indicator.
Applications IqOption Alligator
This instrument for technical analysis is mostly suitable with two major tasks: 1) prediction of the new trend beginning and 2) definition of the existing trend strength.
Definition of the trend’s strength
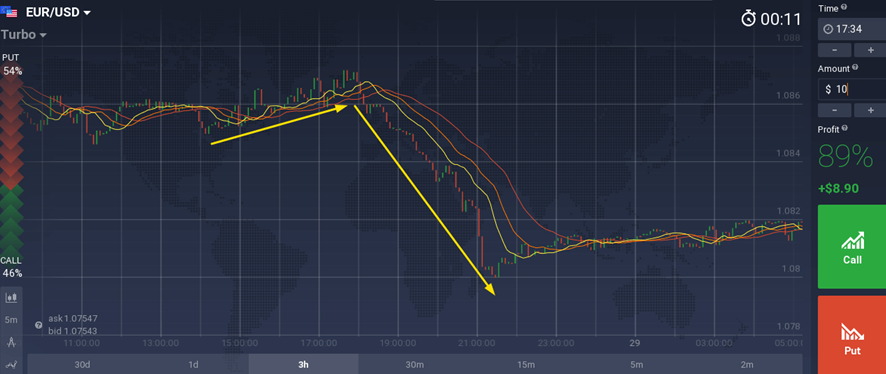
The combination of the distance and slope of the basic lines defines the strength of a trend.
Example above illustrates a rather weak bullish trend that is then followed by a stronger bearish trend. Plot clearly shows that the absolute value of the slope of basic lines in case 1 is less than the one at the top-down section of this plot. The teeth-to-lips and teeth-to-jaw distance increases significantly as well after the trend changes the direction.
New trend prediction
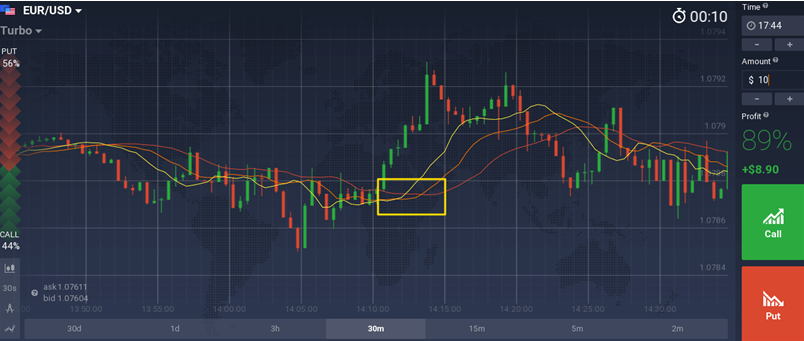
In case when the moving average lines’ amplitude begins increasing, it is quite expected to observe a new trend soon. Formation of the bullish trend is characterized by the lips located above the other two lines, while the jaw and teeth intersection is clearly observed. In case of a market moving downward, the line of lips is located below the other two lines, and the the teeth and jaw intersection is to be available as well.
Things for consideration
The Alligator represents a very unique and special trading indicator, which is appreciated by a lot of professional traders in today’s market. To achieve a successful utilization of this indicator, a few straightforward recommendations are to be followed. 1. Due to moving averages combination, Alligator indicator may sometimes have delays in signals it provides. Hereby, you should always remember that the actual trend starts before the indicator actually shows. 2. Professional traders prefer combining the Alligator indicator with some other indicators for trading in order to attain maximum accuracy and predict the potential more precisely. Moving average divergence, convergence as well as MACD are good selections. 3. It is always useful to double-check the beginning of trends on a frame with higher time.
Leave a Reply