Psychological Line (PSY) is an oscillator-type indicator that compares the amount of the rising periods to the overall number of periods. Generally speaking, this indicator demonstrates the percentage of bars that close higher than the previous bar over the specific time period.

The Psychological Line Indicator may be applied on daily, weekly or monthly timeframes and any asset. In this article, we explain how this great indicator works and how to start using it in trading.
How does it work?
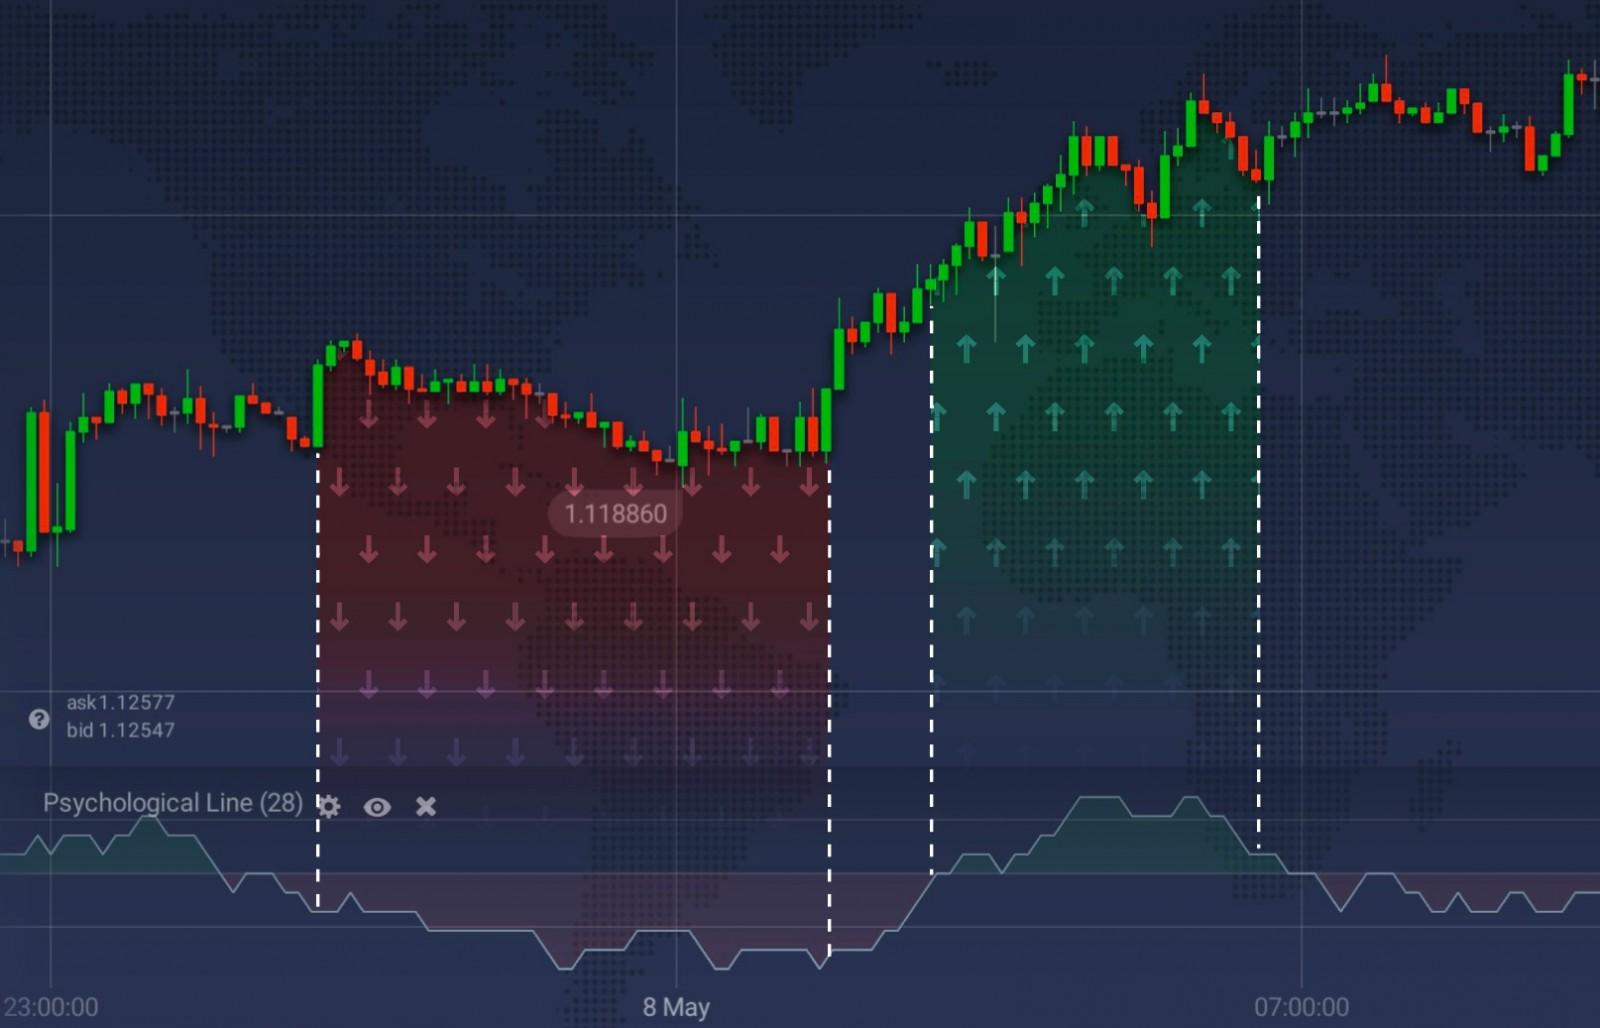
Because Psychological Line is an oscillator, it moves between 0 and 100. If the indicator is higher than 50, the market is under buyers’ control and it is expected that the bullish trend will arise. If the indicator is lower than 50, sellers dominate the market and it is believed that the bearish trend will appear.
PSY just like many of other oscillators, has oversold and overbought levels of its own. If the PSY is higher than 70, it is considered that the asset is overbought. If the indicator is lower than 30, it is considered that the current asset is oversold.

The higher the indicator, the stronger the bullish trend, respectively. Vice-versa, the lower the indicator, the stronger the bearish trend. In order to make sensible trading decisions, you may use the readings of the PSY.
How to use it in trading?
The PSY, just like any other indicator, is applied in order to give signals of its own or to approve signals that are sent by other indicators. There are some ways how you can apply it in your trading. It is essential that you understand that the PSY is a supportive used and shouldn’t be used individually. If you use the Psychological Line as your main tool, you should always use other types indicators to approve its signals.
Traders, who trade with trends, will usually open a buy trade, if the PSY is in the green zone, which is higher than 50 and a sell trade, if the PSY is in the red zone, which is lower than 50.

Overbought and oversold levels, 70 and 30 accordingly, may as well be used in trading. If the price crosses the 70 line from below, the asset is considered to be overbought. Because the asset can’t remain in the overbought position all the time, it will have to leave at some point. Consequently, a new downturn trend may be awaited. The same happens with the asset which remains in the oversold position for a long time. The price will have to go back up at some time. However, Psychological Line can’t forecast the accurate moment when the reversal is awaited. You will have to estimate it on your own with the use of other indicators and your experience.
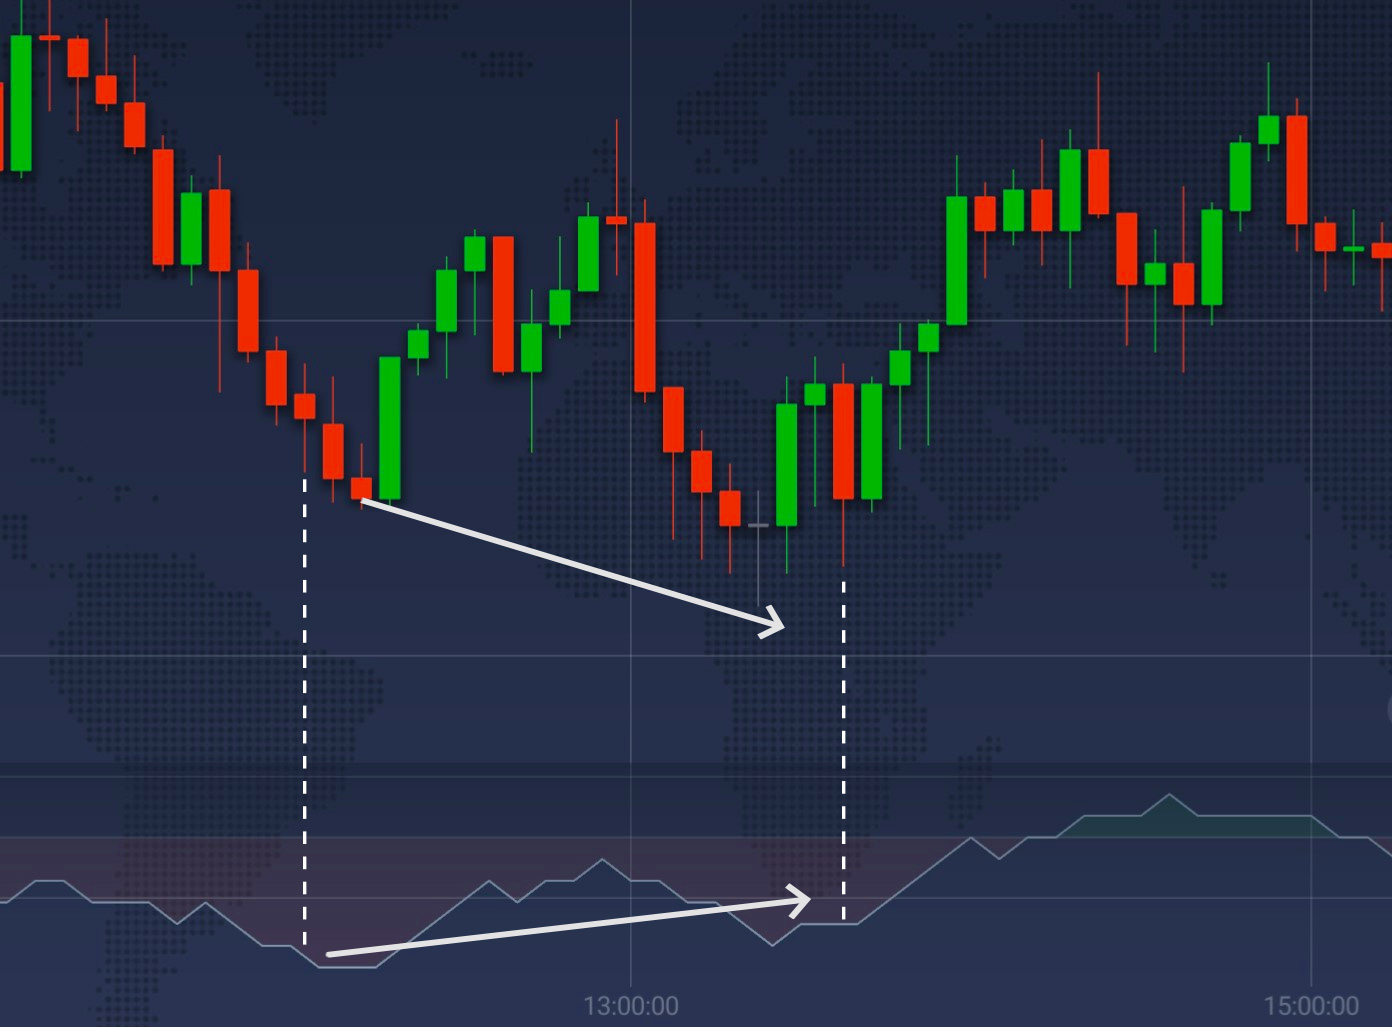
There is another type of the signal this indicator is able to send. If the Psychological Line goes in one direction and the price of the asset goes in the opposing direction, a divergence arises, which relates to an emerging trend shift.

It does not matter how you use the PSY, keep in mind that Psychological Line, just like any other indicator, is not able to give correct signals all the time and it will give false signals. It is your responsibility to double check the readings.
How to set up?
It is pretty simple to set up the PSY indicator:
1. Click on the “Indicators” button in the left bottom corner when you are in a trade room
2. Go to the ‘Other’ tab and choose Psychological Line from the list of available options

3. Don’t change the settings and click ‘Apply’ button
You may set the amount of periods used for the calculation. The higher this amount, the less sensitive PSY will be. The lower the amount of periods, the more sensitive the indicator will be, but the amount of false alarms will increase.
Now you can the Psychological Line indicator!
Now that you know how to use the Psychological Line in trading, you may proceed to the trading platform try it yourself! Most likely, it will become one of the most important tools in your trading strategy
Leave a Reply