What is Fisher Transform Indicator?
IQ Option trading platform offers you a big variety of indicators. For the purpose of using each technical analysis tool in a right way, you have to first get familiar with all of them. In this article, we will talk about a trend-following indicator, which can become a great part of your trading system.
Ehler’s Fisher Transform was created and introduced by J.F. Ehlers. It is a famous technical analysis indicator that translates the asset price into a Gaussian normal distribution. It might sound frightening at first but once you master the main principles of it, you will get a clearer picture of how it works. In this article we will talk more about technical than usual. However, don’t be scared everything you learn can also be used practically and it will help you get better in your trading.
Now, we will explain how the Ehler’s Fisher Transform indicator works and how to apply it in trading. We should mention that this indicator works on all assets and time frames.
Normal distribution and trading
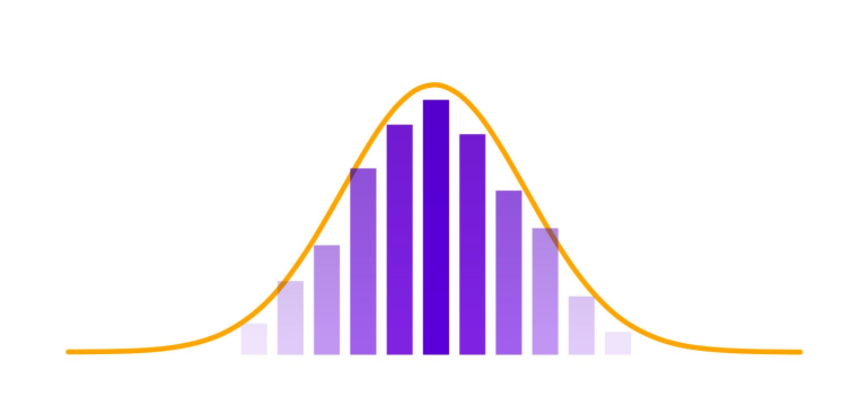
Because we talked about a normal distribution, it can be a good idea to explain the concept behind it. A normal distribution, which is as well called as the bell curve is a common probability distribution. For a data set which is considered to be normally distributed, the following statements will be true:
1. The Mean value is equal to the Median value;
2. The left and the right parts of the graph are symmetrical.
This is how a normal distribution looks on a graph.

Many things follow a normal distribution such as errors in measurements, heights of people, blood pressure, marks on a test etc. Yet, there are as well quantitative variables which do not follow a normal distribution, and the asset price is one of these quantitative variables. It is difficult to forecast and analyze them.
We are done with the theoretical part, now let’s get to the practical part!
How to use it in trading?
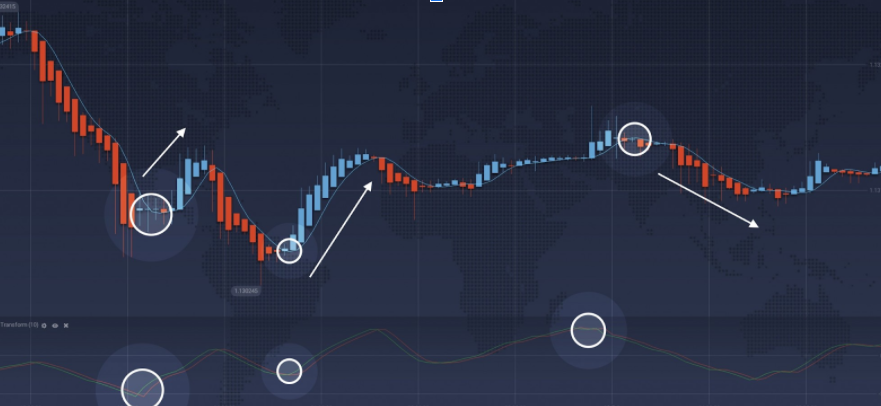
Ehler’s Fisher Transform transforms prices into a normal distribution which then may be applied in technical analysis. Because the indicator follows a normal distribution, positive extreme values and negative extreme value of the indicator are exceptional. So when Fisher Transform is higher than the zero line and moves up, the asset is considered to be overbought. When Fisher Transform is lower than the zero line and decreases, the asset is considered to be oversold. Consequently, in each of these cases, the probability of a trend shift gets bigger with time. If you receive a BUY or SELL signal from another indicator, that approves the signal sent by Fisher, traders think about opening an appropriate position.

Fisher Transform is commonly compared to the Stochastic Oscillator. Actually, both of them work similarly, showing overbought and oversold positions. Therefore, they indicate the moments when price changes are considered to appear. If you work with Fisher Transform or Stochastic, you may need to apply extra indicators in order to approve their signals.
Note that Fisher Transform just as any other indicator is not able to give correct signals all the time.

Ehler’s Fisher Transform is specifically valuable because as professionals say it tends to create BUY and SELL signals earlier than other leading indicators and this may help you make decisions quicker.
How to set up?
It easy to start using Ehler’s Fisher Transform:
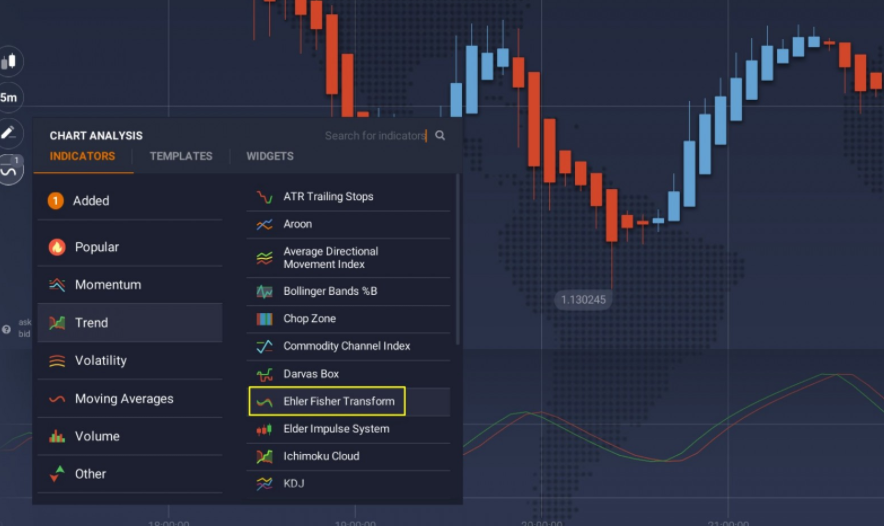
1. Click on the “Indicators” button in the left bottom corner when you are in a trade room.
2. Go to the “Trend” tab.
3. Then pick Ehler’s Fisher Transform from the list of available indicators

4. Click “Apply” if you want to use the indicator with default settings.
You can set its period in order to have a higher accuracy and less false alarms.
Now you can use the Ehler’s Fisher Transform indicator.
Now that you know how to use Ehler’s Fisher Transform in trading, you can go to the trading platform and give it a try!
Leave a Reply