What is IqOption RWI Indicator?
Specific indicators may help you identify the direction of the price change (which is not clear sometimes). Random Walk Index (RWI) is even more particular. It can help you identify if the price moves randomly or if it is a piece of a bigger trend.
Maybe you already know that the trend is your number one friend and that you have to “trade with the market, not against it”. If you use Random Walk Index, it may be easier to identify the real direction of the price change and follow it.

RWI was originally created for the stock market, but this indicator is now used for all asset types and all time frames.
How does RWI works?
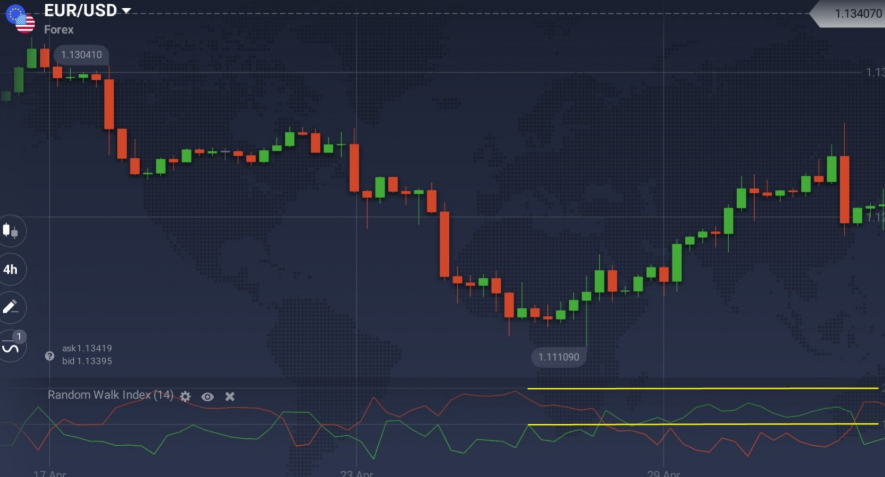
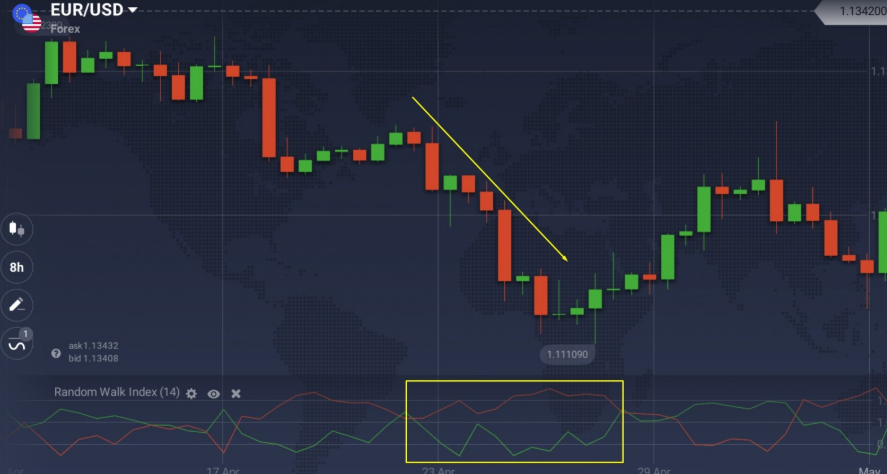
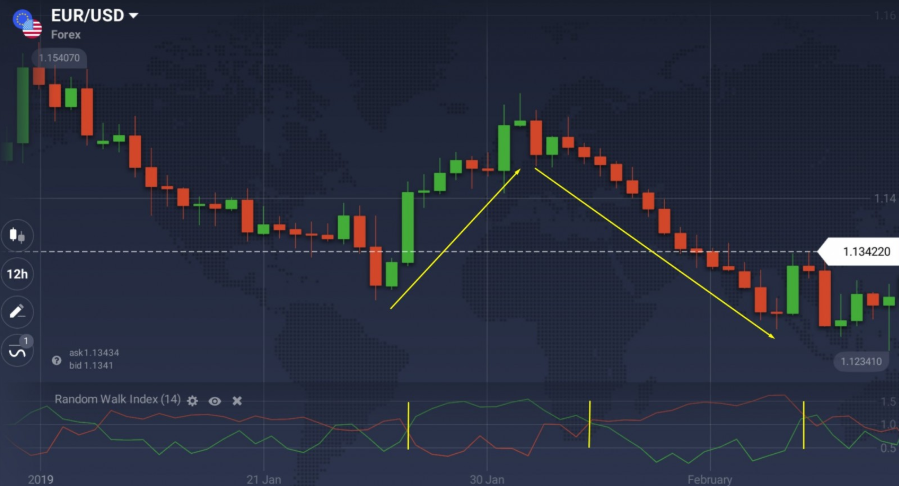
Random Walk Index is actually a combo of 2 lines: the red, which is responsible for the strength of the downward movement, and the green one, relates to the strength of the upward movement. There are as well some levels which are horizontal lines that are demonstrated as 1, 2 and 3. If red and green lines fluctuate around ‘1’, most price moves are probably random. When one of the lines goes above ‘2’, the price action may be connected to a trend. If either of the lines crosses ‘3’ from below, a certain strong trend arises.

It is easy to read the RWI but it doesn’t mean that it is easy to trade with this indicator. The higher one of the lines moves, the stronger the current trend is. The trend is positive if the green line is goes up and the trend is negative if the red line rises. Thus the RWI can help you identify not only if there is a trend, but also trend strength. However, the RWI does not give any information on the trend duration.
How to use RWI in trading?
There are two ways how you can use the RWI.
Firstly, you can use it as a independent analysis tool. For example, a trader will most likely decide to open a BUY position when the green line is above 1.5, and the red line is below 1. And SELL position when the red line is above 1.5, and the green line is below 1. All moves that are below 1 are considered to be random price fluctuations.

Moreover, you can make RWI a part of a more complicated trading system. You may want to use it together with a momentum or a volatility indicator. Moving averages (and their derivatives) also work very well with Random Walk Index. In order to do that you can use RWI as a secondary tool that will approve or refuse signals sent by other indicators. The second strategy will usually mean that you receive less signals but they will have a higher quality.
You have to know that the RWI is a lagging indicator. After a specifically strong trend, it will still indicate to its predominance, even when the former has already died. Keep this in mind when you use Random Walk Index on its own.
As it was said before, RWI won’t help you calculate the duration of the trend. However, there is one trick: usually stronger ones last longer. RWI is very good at identifying the trend strength.

Random Walk Index, just as any other indicator, is not able to give correct signals all the time, no matter how good you use it. Remember that, when you are trading.
How to set up RWI?
It is pretty simple to set up the RWI.
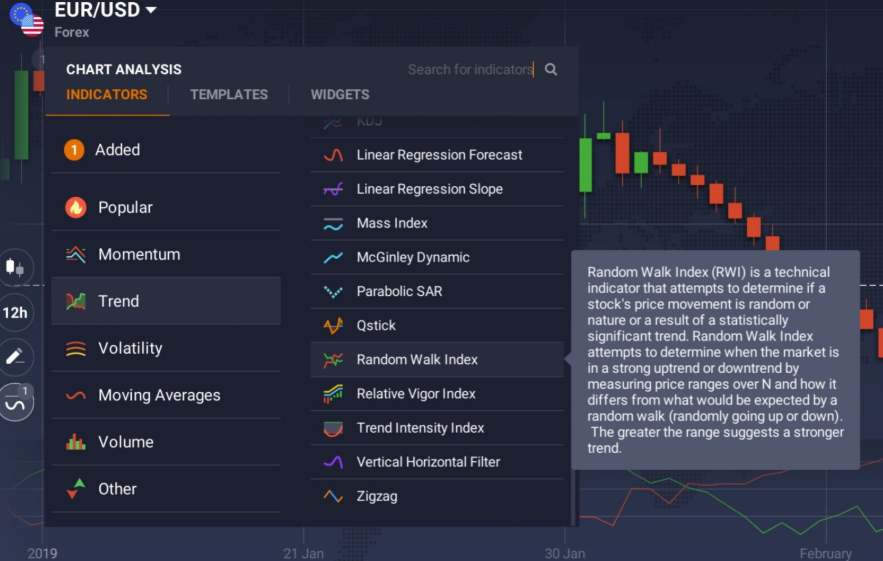
- Click on the ‘Indicators’ button in the left bottom corner of the screen
- Go to the ‘Trend’ tab and pick Random Walk Index from the list of indicators
- Click the ‘Apply’ button without changing the settings.

Now you can use the RWI indicator
Michael Poulos, the creator of the RWI, says that it is better to use it for short-term trades when the number of periods is between 2 and 7, and for long-term deals when the number of periods is between 8 and 64.
Now, that you know how to set up and use RWI to distinguish the trend from the random price movements, you can go to the trading platform and try it yourself. Perhaps, you will find it really helpful in your trading.
Leave a Reply