• Home
  • Trading Indicators
    • ADX Indicator
    • Alligator and Analysis
    • Fisher Transform Indicator
    • IqOption ATR Indicator
    • IqOption Awesome Oscillator
    • IqOption Bollinger Bands
    • CCI and MA
    • CCI indicator
    • Center of Gravity Indicator
    • Chande Forecast Oscillator (CFO)
    • Detrended Price Oscillator Indicator
    • Elliott wave principle
    • Fibonacci Lines
    • IqOption MACD Indicator
    • IqOption Indicator Moving Average
    • Parabolic SAR Indicator
    • Parabolic Stop and Reverse
    • RSI Indicator
    • RWI indicator
    • Stochastic lines
    • Stochastic Oscillator
    • Stochastic Power Trading
    • Support & Resistance
    • Technical Analysis
  • Trading Education
  • Make Deposit
  • Registration
  • Log In
  • Withdraw
  • Reviews
    • About Broker
    • Android App
    • iOS App
    • IQBroker
    • IqOption Affiliate program
    • Iq Option Careers & Work
    • IqOption in India
    • IQ Option Facebook
    • IQ Option Instagram
    • Is IQ Options safe?
    • Is Scam?
    • IqOption Mobile Application
    • Problem with Iqoption
    • Trading Features
    • Tips
    • Twitter
    • Why demo account?
    • USA traders
    • Vimeo
    • YouTube
  • F.A.Q
    • Account Verification
    • Android APK
    • Blocked and Closed account
    • Can i get profit?
    • Client Categorisation
    • Contacts & Support
    • Download
    • General questions
    • How to open demo
    • IQ Option Trading
    • IQ Option Wikipedia
    • Logout
    • Tournaments
    • IqOption Traders Account
    • Trading Fees
    • Withdrawal Process
  • Home
  • Trading Indicators
    • ADX Indicator
    • Alligator and Analysis
    • Fisher Transform Indicator
    • IqOption ATR Indicator
    • IqOption Awesome Oscillator
    • IqOption Bollinger Bands
    • CCI and MA
    • CCI indicator
    • Center of Gravity Indicator
    • Chande Forecast Oscillator (CFO)
    • Detrended Price Oscillator Indicator
    • Elliott wave principle
    • Fibonacci Lines
    • IqOption MACD Indicator
    • IqOption Indicator Moving Average
    • Parabolic SAR Indicator
    • Parabolic Stop and Reverse
    • RSI Indicator
    • RWI indicator
    • Stochastic lines
    • Stochastic Oscillator
    • Stochastic Power Trading
    • Support & Resistance
    • Technical Analysis
  • Trading Education
  • Make Deposit
  • Registration
  • Log In
  • Withdraw
  • Reviews
    • About Broker
    • Android App
    • iOS App
    • IQBroker
    • IqOption Affiliate program
    • Iq Option Careers & Work
    • IqOption in India
    • IQ Option Facebook
    • IQ Option Instagram
    • Is IQ Options safe?
    • Is Scam?
    • IqOption Mobile Application
    • Problem with Iqoption
    • Trading Features
    • Tips
    • Twitter
    • Why demo account?
    • USA traders
    • Vimeo
    • YouTube
  • F.A.Q
    • Account Verification
    • Android APK
    • Blocked and Closed account
    • Can i get profit?
    • Client Categorisation
    • Contacts & Support
    • Download
    • General questions
    • How to open demo
    • IQ Option Trading
    • IQ Option Wikipedia
    • Logout
    • Tournaments
    • IqOption Traders Account
    • Trading Fees
    • Withdrawal Process
Home » Trading Education

Highest High, Lowest Low – 2 IqOption Indicators That Are Meant for Each Other


Highest High and Lowest Low are two technical analysis indicators which demonstrate the highest and the lowest asset price on the price chart as two lines.

If you use these two indicators together, you may have a quite strong trading system.

You can you these tools individually or you can use them as a supplementing tool, which approves or declines the signals received from various indicators. They may also show the potential reversal points, that help you evaluate the probability of a trend change and the probability of a sudden price move.

High and Lowest Low on the EUR/USD

The concept of these indicators is not only very much alike but as well is really simple. Highest High shows the highest price noticed during a number of periods. Lowest Low indicates the lowest price noticed during several periods. You may set the amount of periods when you set up the indicator. The longer the period, the longer the last observed lowest/highest price will rule the chart.  This works the same with both indicators.

Contents

  • How to use it in trading on IqOption?
  • How to set up?

How to use it in trading on IqOption?

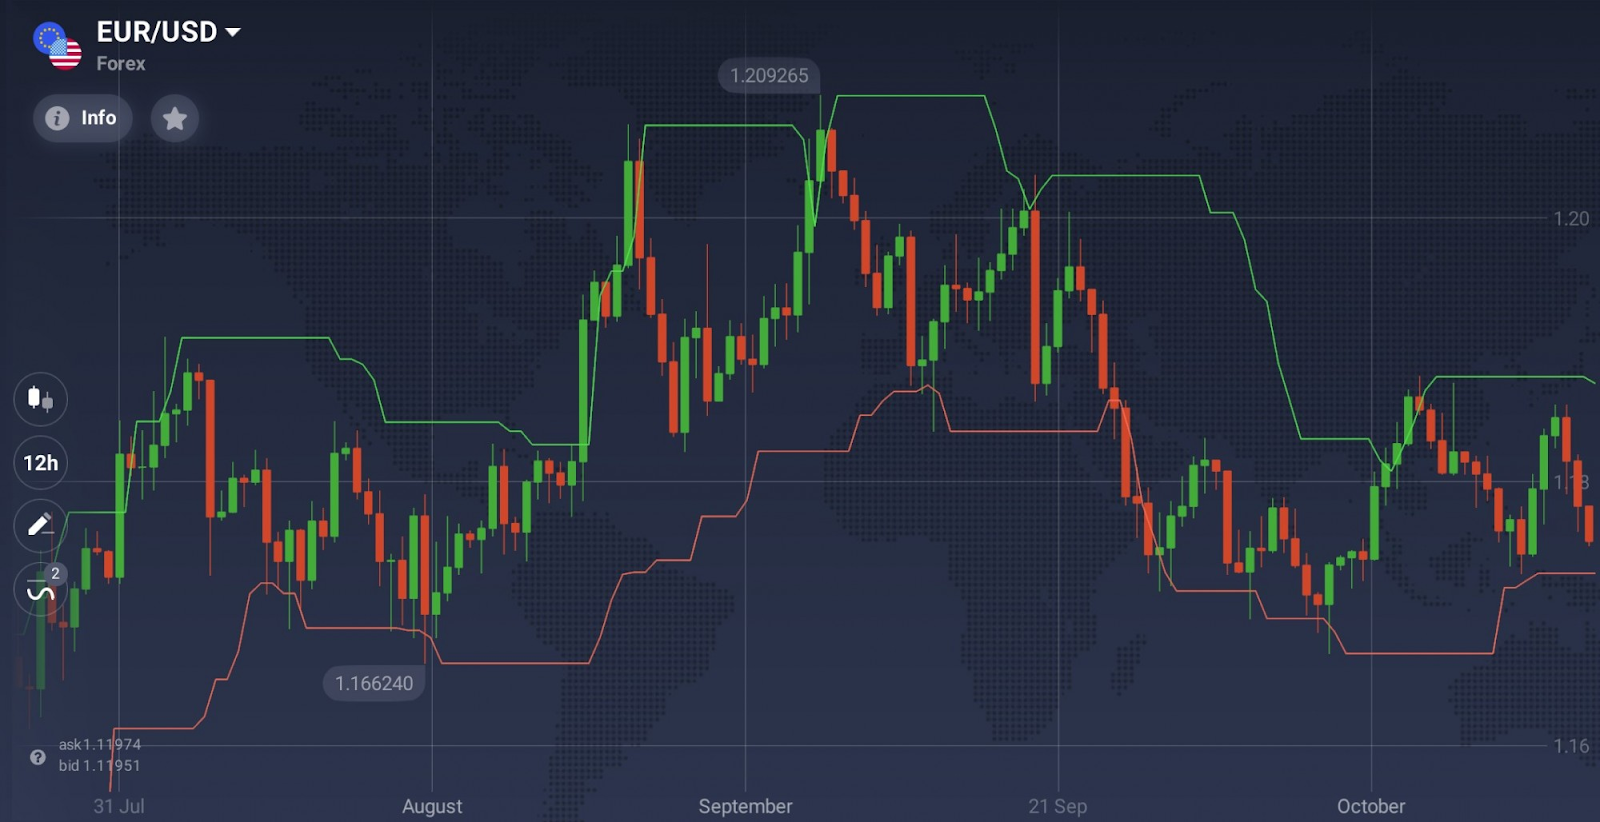
So how can you use Highest High and Lowest Low in your trading. Highest High and Lowest Low indicators may be used in order to work with a dynamic price channel. A price channel is a corridor inside which the price of the asset will move, while the ongoing trend is dominant. If there is a trend reversal, the price channel will follow. Commonly, the price channel is limited by 2 parallel lines. Several indicators, like this one, are able to make their own price channels.

There is another way, how you can apply the indicator. If the price moves only in the price channel, the trader would expect for a trading opportunity to appear. Yet, if the price goes away from the channel, then there are two possible outcome, either the price will keep going in the same direction and setting new maximums and minimums or the price will rebound and go back to the channel. However, it may be difficult to understand what the outcome will be if the price will reach  either Highest High or Lowest Low. You will need to learn to identify  the difference between a rebound and a breakthrough because it may make or break many trades.

3 rebound points created

Several traders may await for the rebound and decide to open a buy position, if the price action has an intersection  with the lower line, which is red line and decide to open a sell position, if the price action has an intersection with the higher line, which is a green line. If traders await for a breakthrough and a powerful trend to continue, they may decide to open a buy position, if the price action has an intersection with the higher line, a green line and they may decide to open a  sell position, if the price action has an intersection with the lower line, a red line.

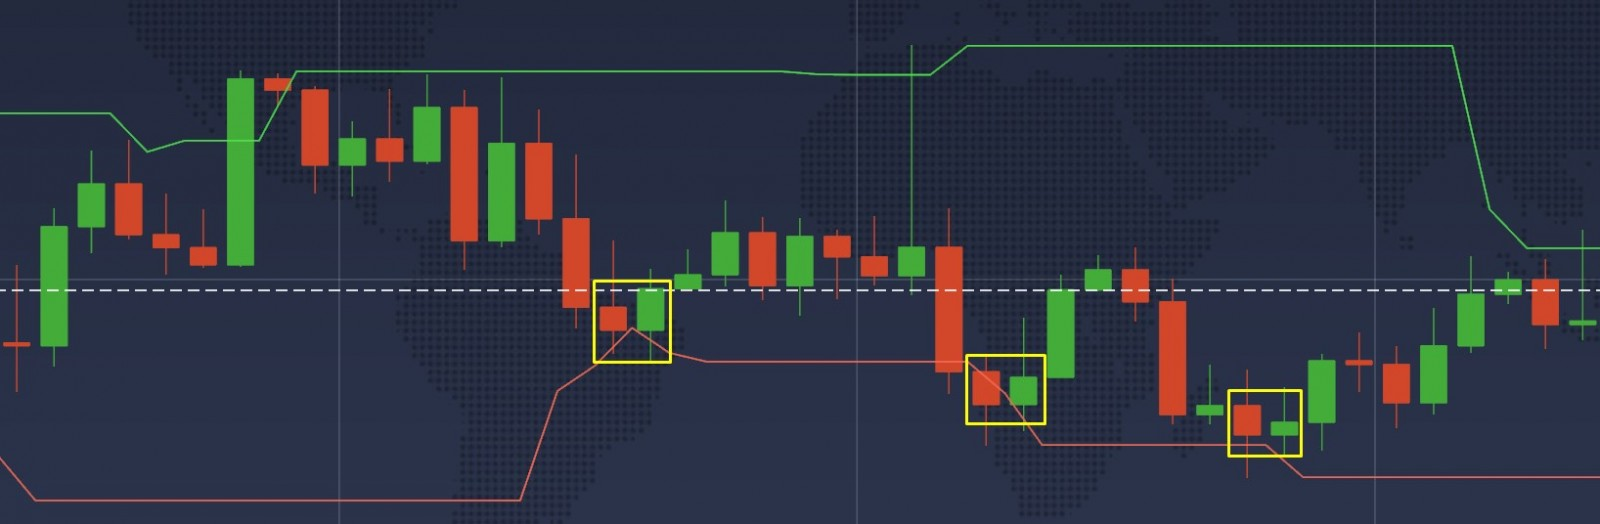
Consequently, It is really important to distinguish between a rebound and a breakthrough. Moreover, an approval can help you a lot. When determining a candle which closes on of 2 lines, you may decide to wait for 2 more candles to close for the purpose of receiving an approval. It can be much simpler to evaluate the future movement if you analyze these 2 candles.

A breakout and a strong positive trend verified

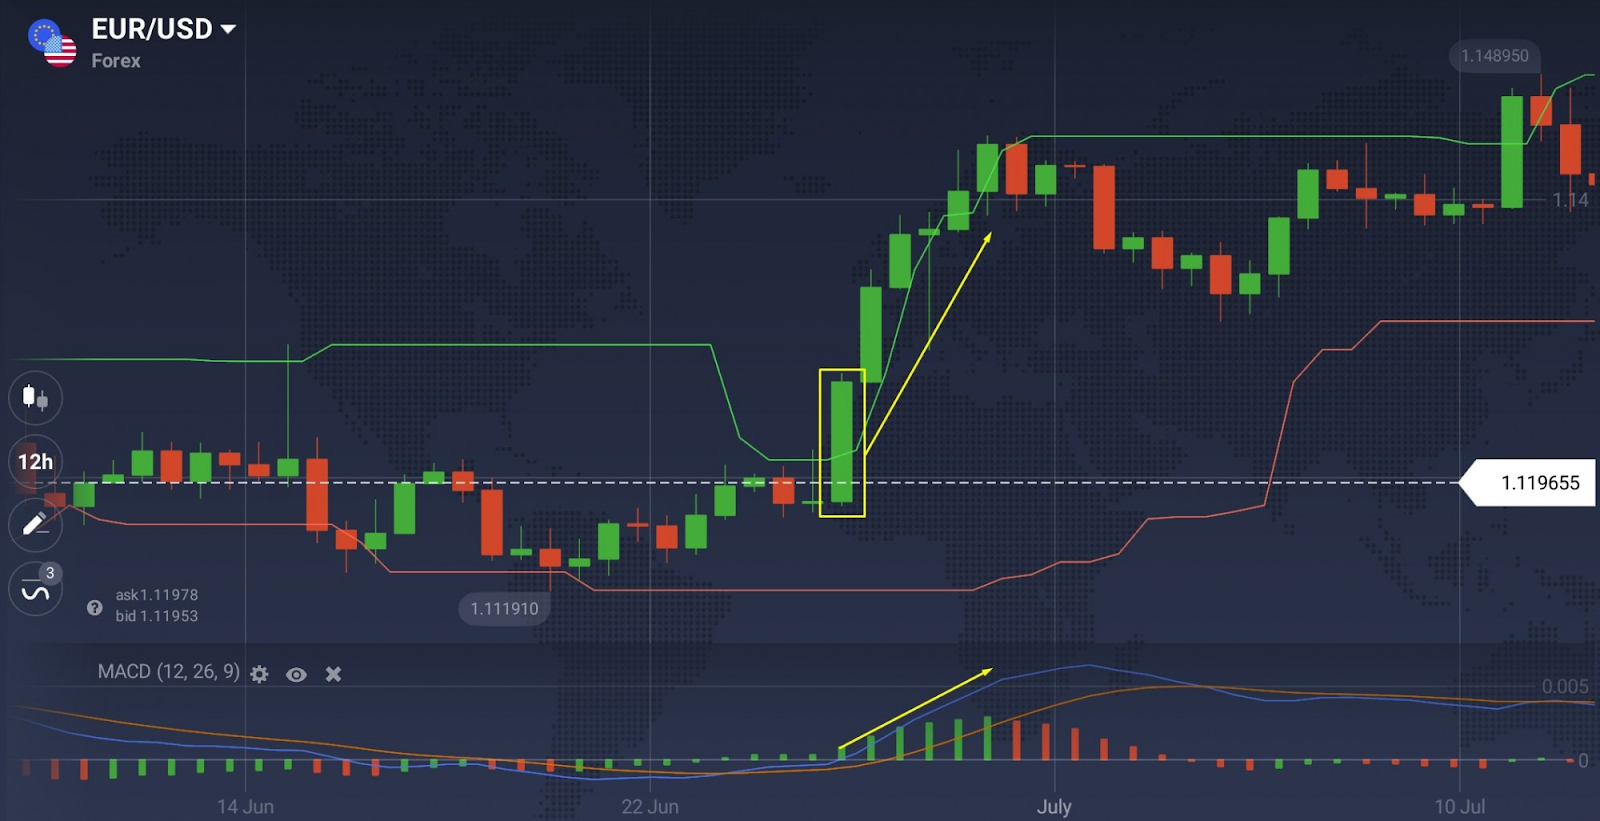
As it was mentioned above, you can as well use Highest High and Lowest Low together with other technical analysis instruments. It doesn’t matter what you are using, you need to find something that works well with these indicators, and these can be MACD, ADX and Trading Volume,  all of them would work well, also better use indicators that are not illustrated on the price chart directly, because it may be hard to perceive all the information. You can think about opening the trade when all indicators show the same result.

Moreover, note that Highest High and Lowest Low, just as any other indicators, are not able to give correct signals all the time, from time to time they may give false signals. Thus, you have to double check the signals sent by these indicators, using other indicators.

How to set up?

Here is how to set up Highest High and Lowest Low indicators:

1. Click the ‘Indicators’ button in the left bottom of the screen

2. In the ‘Other’ tab pick Lowest Low from the list of available indicators,

3. Do the same steps for the Highest High

Now you can use these indicators!

Now that you know how to set up and trade using Highest High and Lowest Low, you may go to the trading platform and try them yourself!


Read Next

What Is a Trading Journal and Why Do You Need One?

3 Comments

Ast Orari
2021-03-05 at 3:50 AM

I was going to invest, but I really don’t know how to do it


Erik
2021-03-02 at 2:59 AM

After read article I can go to the trading platform and try them yourself


Borns
2021-03-01 at 8:57 PM

I tried this method on my own, and everything worked out on the demo account


Leave a Reply

Your email address will not be published. Required fields are marked *

  • Pages

    • About us
    • Account Verification
    • ADX Indicator
    • Android APK
    • Can i get profit from Iq Option?
    • CCI and MA
    • CCI indicator
    • Center of Gravity Indicator
    • Chande Forecast Oscillator (CFO)
    • Contact us
    • Contacts & Support
    • Detrended Price Oscillator Indicator
    • Download
    • Elliott wave principle
    • Fibonacci Lines
    • Fisher Transform Iq Option Indicator
    • General questions
    • How to open demo
    • Iq Option Careers & Work
    • IQ Option Facebook
    • IQ Option Instagram
    • Iq Option iOS App
    • IQ Option Trading
    • IQ Option Wikipedia
    • IQBroker
    • IqOption – Client Categorisation
    • IqOption – Twitter
    • IqOption – YouTube
    • IqOption Affiliate program
    • IqOption Alligator and Analysis
    • IqOption Android App / Google Play
    • IqOption ATR Indicator
    • IqOption Awesome Oscillator
    • IqOption Blocked and Closed account
    • IqOption Bollinger Bands
    • IqOption in India
    • IqOption Indicator Moving Average
    • IqOption MACD Indicator
    • IqOption Make Deposit
    • IqOption Mobile Application
    • IqOption Reviews
    • IqOption Traders Account
    • IqOption Vimeo
    • Is IQ Options safe?
    • Is Scam?
    • Log In
    • Logout
    • Online Trading Broker Review
    • Parabolic SAR Indicator
    • Parabolic Stop and Reverse
    • privacy policy
    • Problem with Iqoption
    • Registration
    • RSI Indicator
    • RWI indicator
    • Search Results
    • Stochastic lines
    • Stochastic Oscillator
    • Stochastic Power Trading
    • Support & Resistance
    • Technical Analysis
    • Tips
    • Tournaments
    • Trading Features
    • Trading Fees
    • USA traders
    • Why demo account?
    • Withdraw
    • Withdrawal Process
  • Recent Posts

    • Balance of Power – Identifying Market Sentiment
    • How to Capitalize on IqOption Marijuana Stocks?
    • How to Measure Risk?
    • IqOption Beginner’s Guide
    • How to Trade a IqOption Falling Asset? Two Rules by Jeff Clark
    • What Time Frame to Trade on IqOption?
    • Improving Your Trades in 5 Simple Steps
    • What Is a Trading Journal and Why Do You Need One?
    • Highest High, Lowest Low – 2 IqOption Indicators That Are Meant for Each Other
    • Why Traders Lose with IqOption? Trading Mistakes You Don’t Want to Make
    • Psychological Line Indicator: Trading Strategy and Tips
    • Trading on IqOprion with Vortex Indicator
    • Market Sentiment – IqOption Mass Psychology for Successful Traders
    • Support and Resistance: Trading Basics Tutorial
    • What Kind of Trader Are You?
    • How to Trade with Parabolic SAR in the Most Effective Way
    • Alligator and Fractals: a Powerful Combination of Technical Indicators
    • 6 Things Every Trader Should Know
    • A Trading Strategy for Everyone – The Bladerunner
    • Why You Should Keep a Trading Journal
    • How to open a trading position automatically
    • Guide to the Bearish Engulfing Candlestick Pattern
    • Why won’t You Make Money Trading Options on IQ Option?
    • Ichimoku Cloud: How to Use Indicator in Trading?
    • Master Stop-Loss and Take-Profit on IqOption Feature
    • 8 Risk Management Tips from the World’s Top Traders
    • Financial Crisis & Trading on IqOption
    • Easy Way to Open Deals on IqOption Automatically
    • Developing a Trading Strategy of Your Own
    • Commodity Channel Index (CCI)
    • Iq Option review
    • Relative Strength Index (RSI) in IqOption
    • Business and Trading
    • John Murphys Laws of Technical Trading
    • Bollinger Bands Width & Unique Volatility Indicator
    • Elder Impulse System
    • Trading with a Multiplier
    • Fundamental vs Technical. What Analysis Type to Choose on Iq Option?
    • Using Stochastic Oscillator in Trading
    • 5 Day Trading Tips
    • Nasty Trading Mistakes That You Probably Make on Iq Option
    • What to do when the market is flat on Iq Option?
    • Trading on Iq Option with Alligator – a trend-craving carnivore
    • Awesome Iq Option Platform Features You’ve Probably Never Heard Of
    • Indicator Templates – Apply All Favorite Iq Option Indicators in 2 Clicks
    • Five Don’ts of Trading — Keep These Things Away with Iq Option
    • Technical Analysis. How Does It Work on Iq Option?
    • Schaff Trend Cycle — Indicator Tutorial on Iq Option
    • Customizing the Iq Option Platform for Optimal Trading Experience
    • Trading with Iq Option QStick Indicator
    • Trading Psychology: 5 Tips to Improve Discipline on Iq Option
    • What Indicators to Use for Iq Option Day Trading?
    • Iq Option Risk Management Basics: The 2% Rule
    • 5 Trading Proverbs – Timeless Wisdom for Iq Option Traders
    • Trading with Williams’ %R on Iq Option
    • Strangle plan Volatility of the Tame Market and Classic Options
    • Trading On News with Iq Option broker
    • Iq Option Trading Education
    • Options Types on Iq Option
    • FX Options
    • Iq Option Digital Options
    • Classic Options
    • Cryptocurrency on Iq Option
    • About Iq Option Binary Options
    • Earning and Investing in Iq Option
    • Traits Successful Iq Option Traders

  • Search


  • Home
  • About us
  • Contact us
It's not an official website of IQ Option. This material is not intended for viewers from EEA countries. Binary options are not promoted or sold to retail EEA traders. © Copyright iqoptions.net - “General Risk Warning: The financial products offered by the company carry a high level of risk and can result in the loss of all your funds. You should never invest money that you cannot afford to lose”
Press enter/return to begin your search