IqOption Parabolic SAR, an Active Traders tool
Parabolic Stop and Reverse (PSAR) represents a perfect indicator for Iqoption active traders. It is planned to be used by iqoption futures traders with an opportunity for open positions.
Parabolic stop and reverse is one of those indicators intended for specialized use. Its design was meant for the so-called futures market, but its application can be transferred really to any form of trading with a price chart. The original use was for offsetting potential losses – hedge positions. Leaving space for coping with and hedging against upcoming price fluctuations needs a position to be open at all times, and is very important in futures trading. When upward trend closes a downward trend position must be established and the other way around. It has been proven in practice that an indicator such as PSAR provides valuable info on optimal opening and closing points.

The person behind iqoption indicator is an American technical analyst J. Welles Wilder Jr. There are numerous things to follow with this indicator like price action and time decay as well. A dot over or under each period’s price action is displayed to signal potential entry and exit points
The way a futures trader keeps tracks of these signals is by following; long positions open up when a dot goes under a “candlestick”. If the price goes under a dot, it means a trend is reversed and that the short positions should open up. Every time a dot changes sides new position opens. A binary, forex or CFD trader can open a new position with each side switch, but this has proven to not be the best strategy. It’s more often than not that a big section of the move happened already, more so by using short term time frames, so waiting for pull backs or relief rallies and tests of support and resistance is often the right move. PSAR is good with identifying support and resistance.
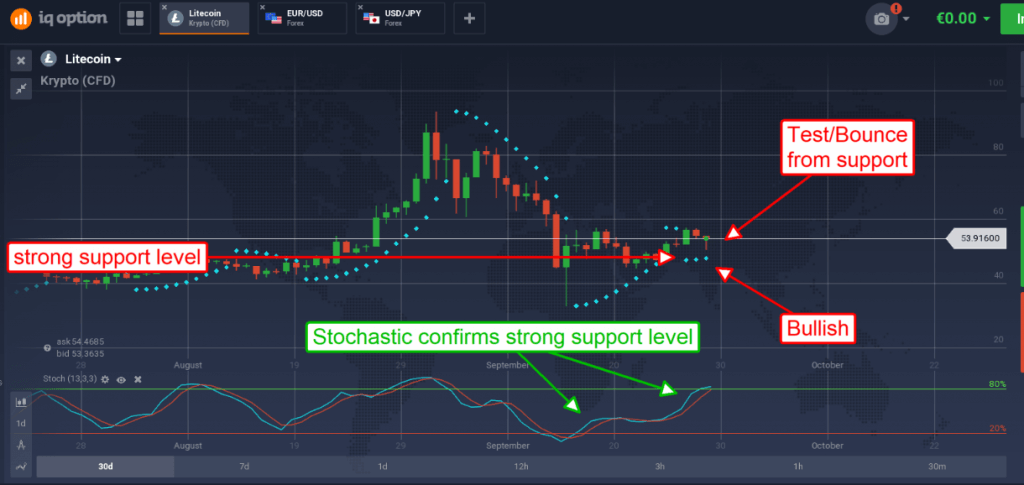
Like with most indicators, PSAR can give both uptrend and downtrend signals in any market kind. This is why traders suggest using extra tools to neutralize best as possible potential false signals. Although using multiple time frames with PSAR can grind it out, mixing PSAR with stochastic is might be the best possible combination. In the example you can see bellow, daily chart is used with PSAR setting the trading direction to today, and then move down to an hourly or 30 minute chart and stochastic for entry signals. The chart in the picture above indicates that Litecoin is trading above the dot making today’s day bullish. Also, the current candle already went down to test support and confirmed. From here, we focus on the hourly chart and wait for entry signals for buying calls or opening long positions.
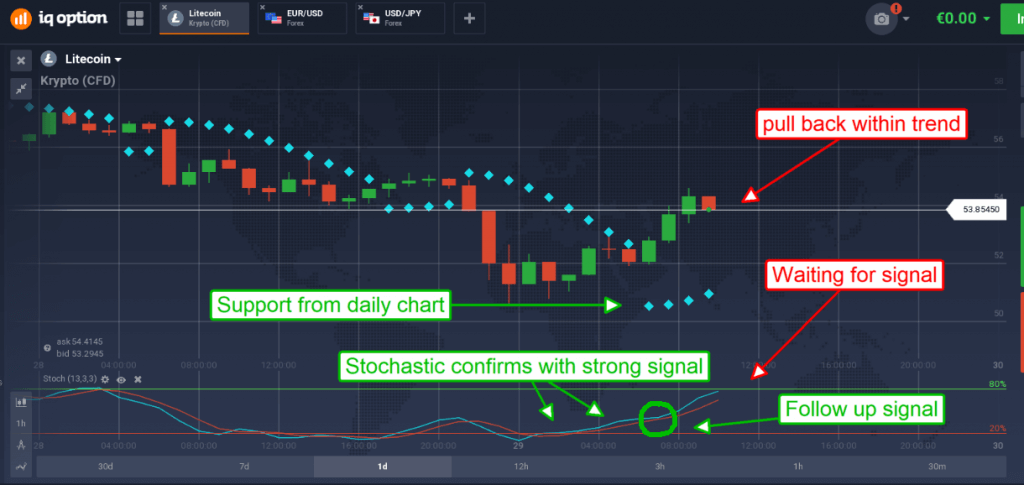
From the chart below we can notice the asset shifting towards higher prices, springing back from support. Stochastic confirms this with a strong entry signal that is constantly rising and reaching for the upper line.

This is where iqoption trader waits for the next stochastic signal as one already exists, so the entry might be risky. The next stochastic signal is expected to be a bullish crossover or any dip of %K to test/bounce from %D. Bullish crossovers include %D crossing the upper signal line or %K dipping below and then bouncing back above %D. Signal can last from an hour to even a week, hinging on market condition.
Leave a Reply