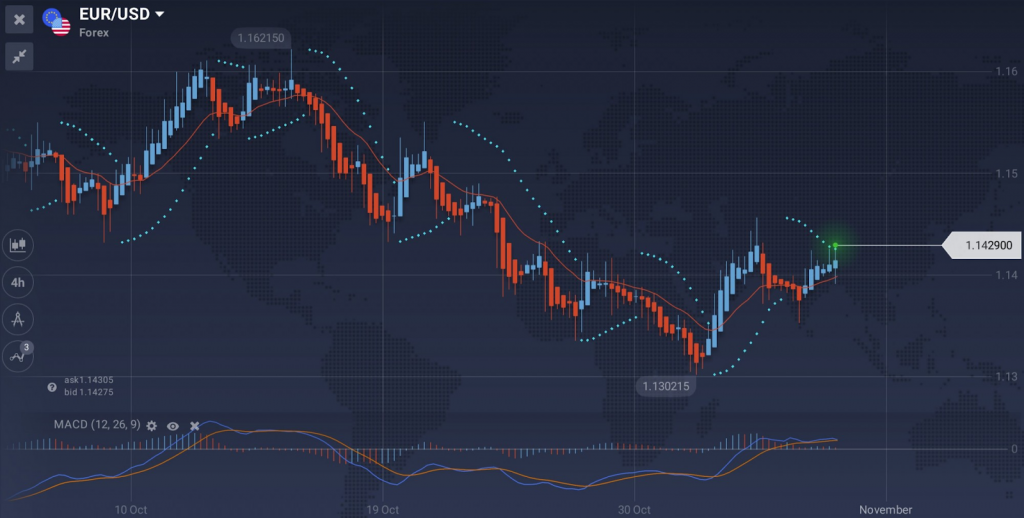
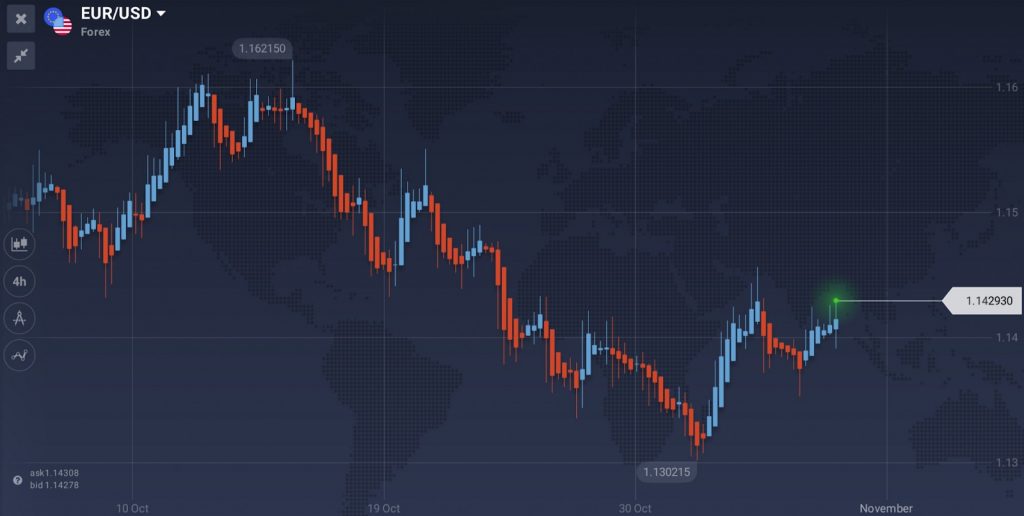
What technical analysis indicators do you have to use if you want to achieve better results? Talking about indicators, IQ Option has a lot to offer. Consequently, it is difficult, specifically for beginners, to choose indicators that fits their trading strategy and use them accurately.
Many professional traders agree that overflow of indicators can distract you and make you lose funds. Professional traders claim that the rule is keeping your trading system simple — 2 to 3 indicators maximum, if any.
It is clear that indicators give an insight into the price action and, thus, help traders. However, the information that gets illustrated by all indicators is already appear to be on the price chart. Experts agree that the use of indicators is not obligatory. Moreover, indicators show the information in a different way, which can help you determine a subtle move or a pattern. Keep in mind that indicators are neither good nor bad — they are just tools. Their helpfulness will entirely depend on your skills and knowledge.

Many indicators work similarly. Take MACD, Stochastic and RSI. Even though they are a bit different, their readings overlap in many cases. But it doesn’t mean that if you have all three actives they will make you any good. Actually, 2 moving averages can fully replace the MACD. Overlapping indicators will always return similar signals and thus can’t be used as a confirmation for each other.
Think about picking one indicator from each category in order to avoid inconvenience in trading systems.
Oscillators are indicators that belong to this group fluctuate between two lines, usually with upper and lower boundaries. Oscillators include the RSI, Commodity Channel Index (CCI), Stochastics, MACD and other.
Overlays are these indicators which are placed directly on the price chart (unlike oscillators that are situated below). Bollinger Bands, Moving Averages, Parabolic SAR, Fibonacci Retracements and many more appear to be in this category.
How to combine Iq Option indicators?
The choice of specific indicators may rely on on your trading style, the asset you trade and your individual preferences. Nonetheless, there are particular rules that may help you establish a balanced trading system.

As it was mentioned above, you may want to choose one indicator from each category. For instance, trader might use MACD to identify the direction and power of the prevailing trend and then find the best entry/exit points with the help of Bollinger Bands.
Every oscillator can be combined with any overlay. However, specific combinations work better than others. It is still feasible to use more than one overlay at the same time. For example, Parabolic SAR is commonly combined with a moving average. However, it is important to keep the trading screen clean and tidy, as overflows of information will probably distract you and worsen your performance in general. Keep in mind that any combination of indicators can and will give false signals at some point. Indicators are just tools and can’t trade all by themselves. Your opinion should advise you.
All in all, use no more than 3 technical analysis tools. You have to understand how your indicators work, what is their purpose and limitations, what type of results you can expect when you work with them, how frequent they give false signals. If you know all this, you will be able to use your indicators more effectively.
Leave a Reply