What is IqOption Technical Analysis?
IQ Option’s most crucial feature is the ability to attach symbols and markers to online diagram. In other words, IQ option provides the ability of using technical analysis. Usually binary option platforms that are web-based, rarely include drawing tools and built-in indicators. Those technical analysis tools make IQ Option exceptionally functional and efficient. This article focuses on explanation of the true benefit of graphics tools and the benefits of using the indicators and drawing board on daily basis.
What is the Importance of Drawing on iqoption?
The drawing board represents a crucial tool for technical analysis due to the fact that a lot of trading systems and strategies are created based on the idea that traders tend to rely on certain diagram elements, e.g. the resistance and support lines. Each trader picks by himself the shapes, lines and timeframe he wants. That’s why it is very handy to plot markers directly on a diagram. There are plenty of means to apply those markers. The most general way is to use them to display trends. Trend represents the most crucial part of trading options, and hereby trends tracking represents a high importance. Utilization of the drawing board for construction of markers for graphical analysis and pointing out patterns of the chart like Triangle, Diamond, Head & Shoulders, Three Peaks etc., can be extremely effective and useful.
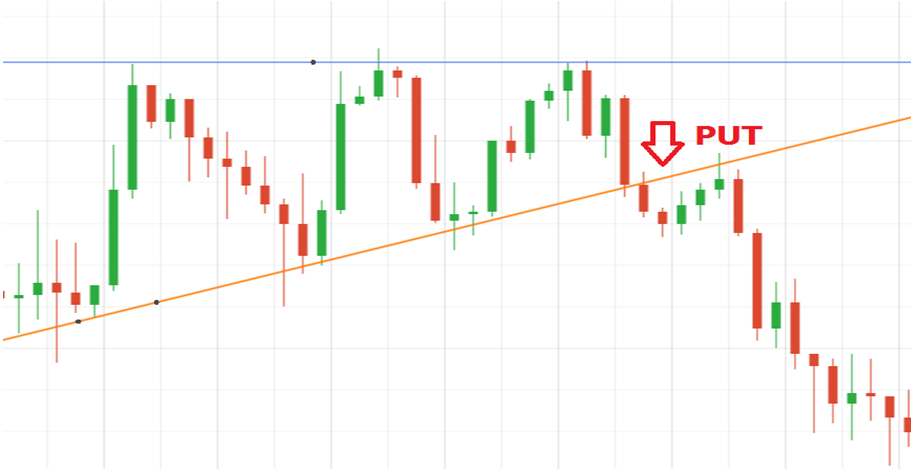
Based on the diagram it can be seen that a Three Peaks pattern is already forming, however it is not easy to rely on sight to find the entry point, i.e. the breakthrough point of the support line. You can continue tracking of the correctness of the process related to figure generating and eventually receive a clear entry point with help of graphics only. Those tools can be used not for simple patterns and graphic strategies created on the diagram only. They also can be applied in conjunction with other indicators available on the platform.
IqOption Indicators for Technical Analysis on binary options
The platform contains four widely used indicators – moving averages (MA), Bollinger bands, Alligator and Relative Strength Index (RSI). All those indicators can be applied individually as well as in conjunction. Indicators assist traders to forecast the price movement direction more correctly and precisely.
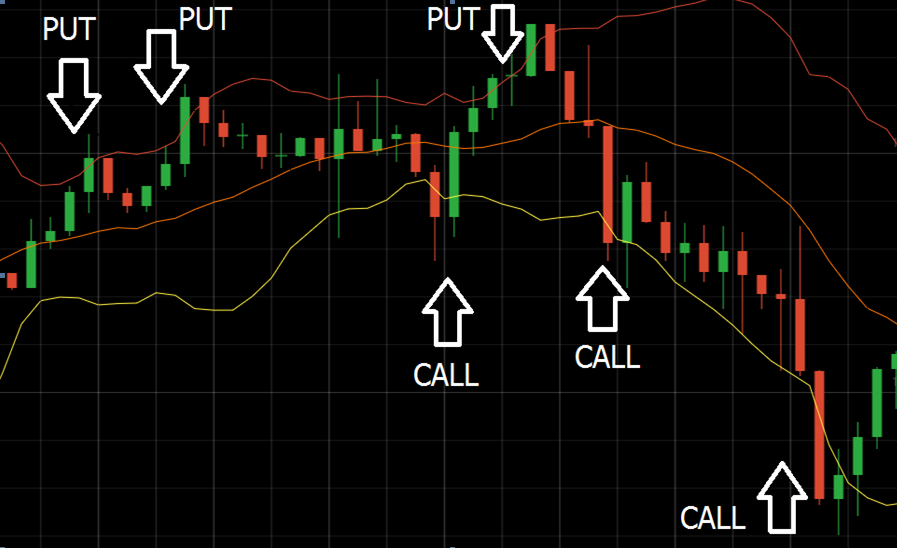
Bollinger Bands on iqoption
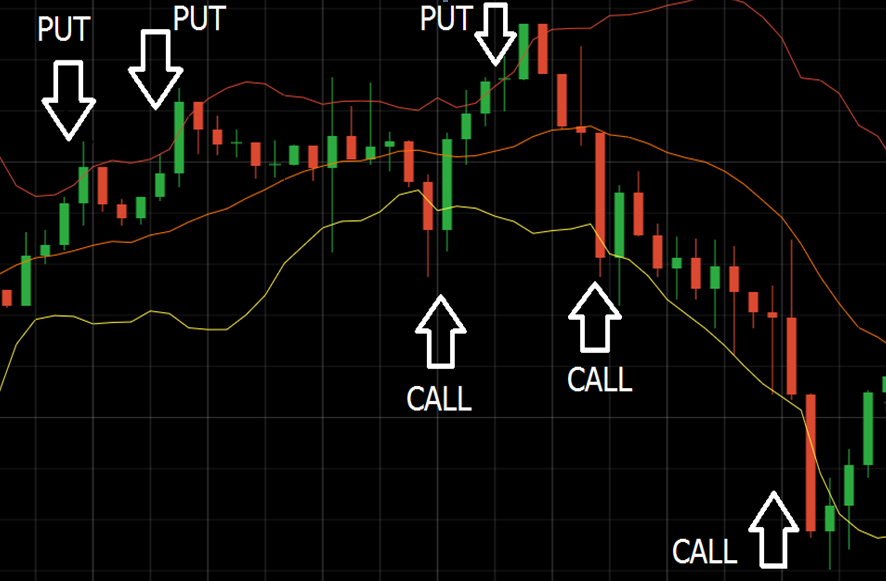
Bollinger bands are among the most famous indicators. It constructs the corridor for the price to move based on the data received from the standard deviations and moving average. By monitoring the borders of corridor, traders receive signals for the most suitable entry. When the price breaks the lower limit, it is a signal to purchase CALL options, while in case when it breaks the top limit, it is a signal to purchase PUT options.
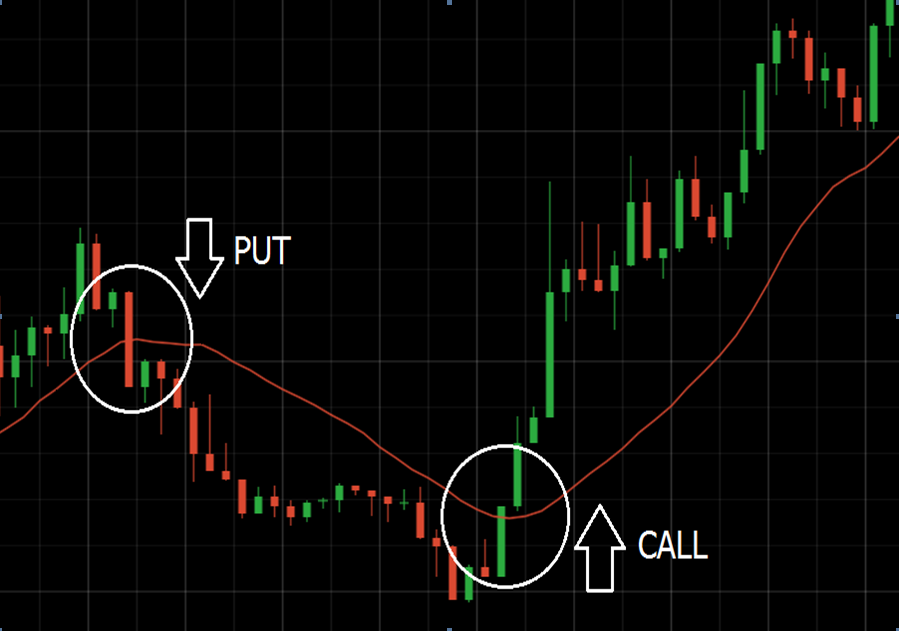
Iqoption Moving Averages
Moving averages display the asset’s average price on the basis of a predetermined interval of time (e.g. 14 days). When the diagram crosses the moving average, a trader should start buying options located in the breakthrough direction. As the time interval gets longer, the signals become more accurate. However, the number of signals tends to decrease.
Iqoption RSI trading tool
Relative Strength Index (aka RSI) can be used only in case of candlestick charts. This indicator is very famous and is among the most widely used indicators in the world. It shows both the magnitude and strength of changes in price. Comparing with other indicators, RSI does not appear on the chart itself, but in a separate window below the chart. Plenty of diversified strategies rely on that indicator. RSI displays oversold and overbought levels of an asset on the basis of historical data. When the asset is overbought, it is a signal to buy PUT options, while when it is oversold, it is a signal to buy CALL options.
Alligator tool for iqoption trading
Alligator is also unless famous comparing to other indicators listed above. It consists of three moving averages (MA) with three various periods. Once the lines cross, it denotes that the trend is about to start. When all three lines begin pointing in the same direction, the trend gets initiated. Afterwards, the trader is required to follow the trend. Traders from all over the world use a lot of profitable and straightforward strategies that are based on Alligator.
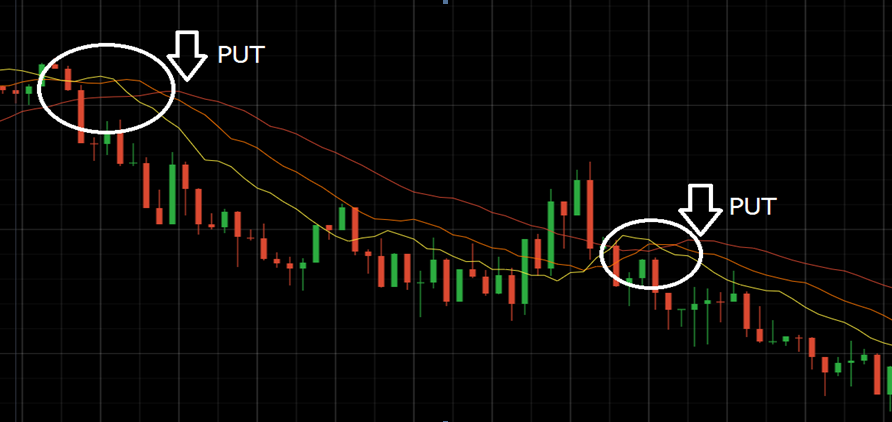
Utilization of indicators for technical analysis assists to receive distinctive entry and exit points as well as the analysis data that is completely understandable and not really complicated. In addition, the trader can use Alligator to track all the arising opportunities, because the thorough price movement analysis is relied upon not only the information provided by indicator. In case of Bollinger Bands, for example, traders rely on resistance and support lines in order to receive a clear and correct signal for entry. Bollinger Bands reduce the risks for traders. It is worth pointing out that it is nearly impossible to plot such lines without having a drawing board. The use of a variety of graphics and indicators at the IQOption platform is unlimited. You are free to include all necessary indicators and markers at the same diagram in order to enhance your technical analysis and make it more precise. Additional information for this topic is also available in the article called Parabolic SAR, MACD and Stochastic. The IQ Option UK is able to create a significant assistance for different traders, because it has all the necessary tools for the appropriate and efficient technical analysis. It helps traders to locate the exit and entry points in a very effective manner, as well to carry out the diagram analysis and, hereby reduce the associated risks significantly. You can generate a higher income by combining diagrams and indicators and make them filter the received signals via diversified tools. It is crucial to point out that drawing tools can support traders when dealing with specific indicator-based strategies, as well as create the strong and reliable basis for generation of profitable strategies. In addition, drawing tools are really handy for working and hedging patterns. All the abovementioned factors make the drawing panel of IQ Option really important and extremely useful for all traders. Application of graphics and indicators for trading can ensure a stable income.
Leave a Reply