What is IqOption Stochastic Lines?
Unlike in binary option, forex profits and losses can be a lot bigger so forex requires stop-loss and profit targets sometimes even more than the original entry. Forex pairs are prone to trade in firmly fixed ranges, which makes support and resistance targets within those ranges are very handy in the case of stop-losses and profit-taking.
The ground foundation of this method is using stochastic for trend following entries. Depending on your own preference, the time frames used, and entry points found, the trends you’ll be dealing with can be near, short or long term. It’s important to notice if the prices are going up or down. Trade bullishly when their going up, and bearishly when going down.
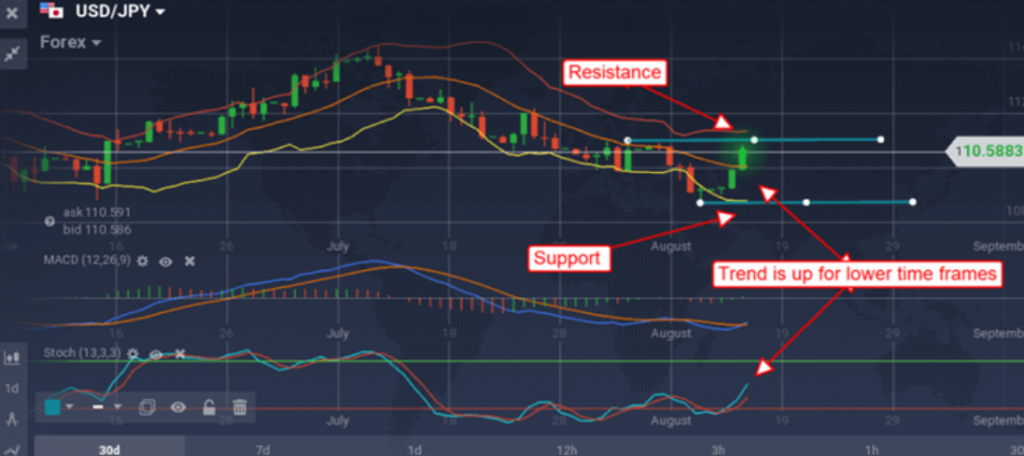
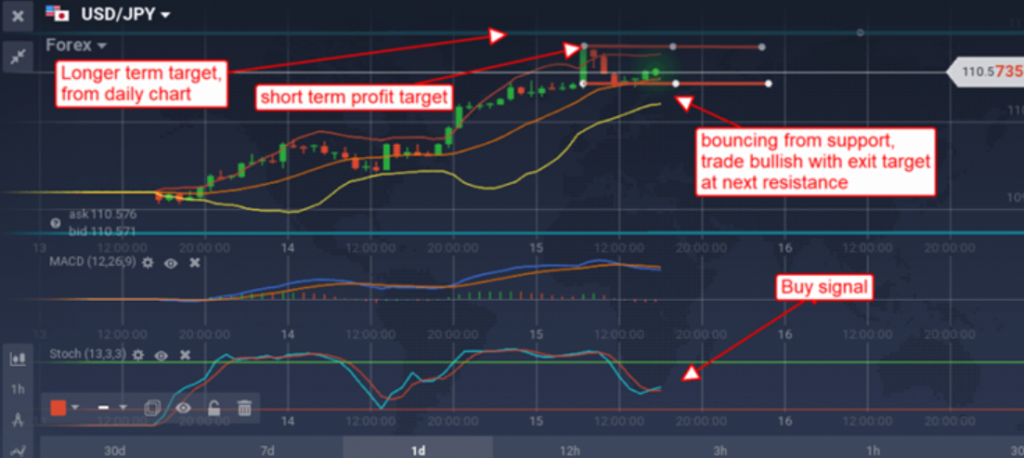
Locating entry point start with the daily chart and establish crucial support and resistance lines. The ones nearest to asset price are the ones most important to you. Then focus on the hourly time frame chart and check out if there are any other support and resistance lines you can establish that are inside the longer term lines in the daily chart. After that, move to a 30 minute, 10 minute or 5 minute chart (whichever suits you the most) and try looking for even closer term support and resistance levels if they are available.
The Iqoption daily Stochastic chart

The hourly Iqoption Stochastic chart

The signals appear once price action breaks through a support or resistance line or stays around the line for long enough, thus establishing it. To separate and extract any false/weak entries, use the trend following rule. In other words, only consider entries in line with the trend. Sometimes the prices might provide a false signal by sinking under the line for a short period of time, checking the support. Emerging back above the line will represent a good signal.
Tactics on holding a position mainly depend on which line you are currently trading from. Note that a support or a resistance line that are put on the 5 minute or 1 hour chart will not show the same result as the line drawn on the daily chart. Daily time frame charts tend to show the strongest signals and can produce long lasting movements that can even go for months. Hourly charts are not so strong at producing signals, and although they can sometimes be as strong, it’s not as likely. Naturally, the shortest time frames are the weakest indication, and can only be expected to produce short duration movements.
Next on the line are profit taking targets. They represent the next line of resistance or support. For example, if the trade shows uptrend and the price continues to go above the support line, the following resistance line is the right profit target. When prices start closing in on that line, or they start looking like they are about to go over it, the optimal profit target is established. It is preferable that profits be taken here. The forex option in the IQ Option platform lets you set the desired target profit, although some careful traders might think it’s best to pull out when coming to a certain price target, like support and resistance.
Leave a Reply