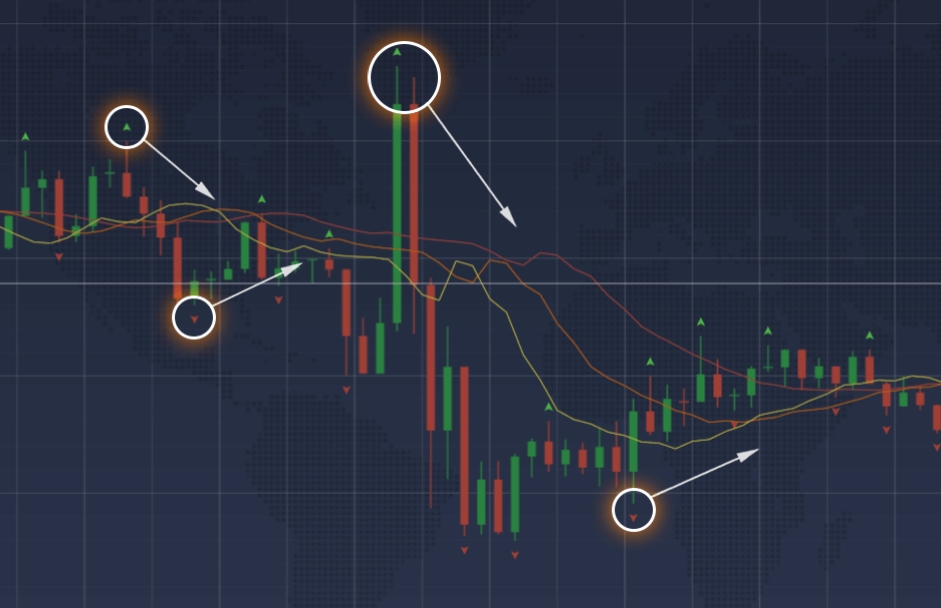
Alligator and Fractals, two of the most famous technical analysis indicators, may be combined in order to generate an interesting trading system. Applied together, they have the capability to give powerful and precise predictions. The indicators may be used with any asset and on any time interval.
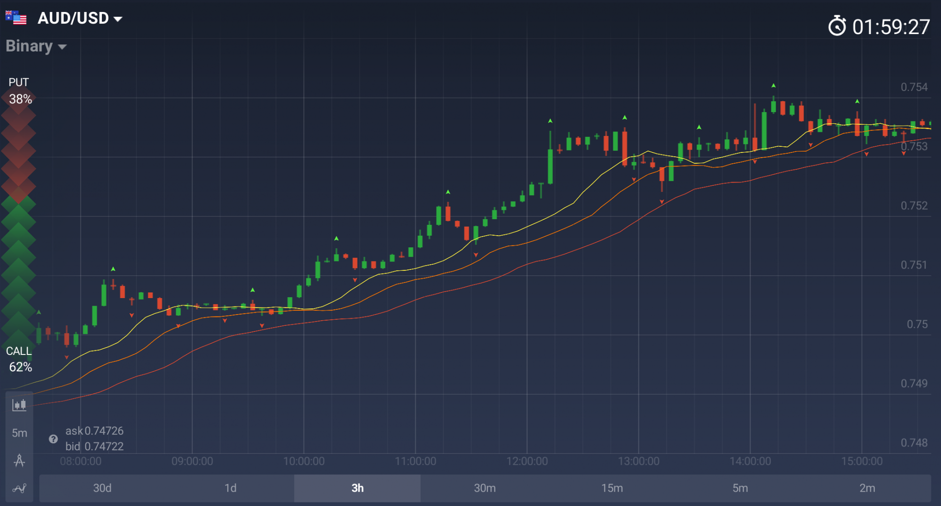
Alligator is a technical analysis tool, which is a combination of three lines placed on the price graph. The lines symbolize the jaw, the teeth and the lips of the alligator. It is applied to identify the trend and forecast its future direction. Fractals, in turn, are repeated patterns which may forecast reversals among larger, more chaotic price movements. Two indicators may complement each other ideally.
How do they work?
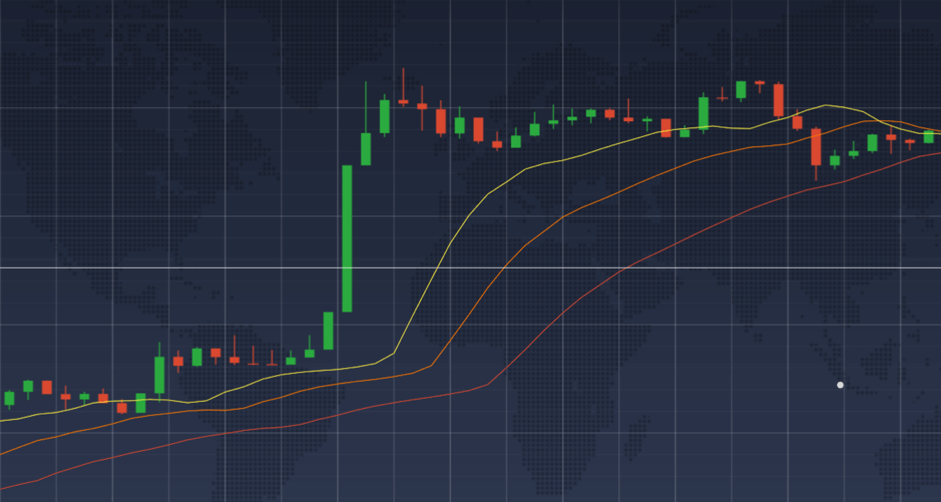
Alligator is a combination of 3 smoothed moving averages with periods of 5, 8 and 13, that are all Fibonacci numbers. Every line is shifted forward for a particular period of time which depends on the short-run or long-run orientation of that certain line.
1) The Alligator’s Jaw (red) is a 13-period SMA, shifted into the future by 8 bars;
2) The Alligator’s Teeth (orange) is an 8-period SMA, shifted into the future by 5 bars;
3) The Alligator’s Lips (yellow) is a 5-period SMA, shifted into the future by 3 bars.
This analogy is applied to explain the way the indicator works. Sideways trends are marked with the alligator’s closed mouth — all three lines get closer to each other and sometimes cross. This is when the alligator is asleep, and the most cautious traders don’t make new trades. The longer the alligator is waiting, the hungrier it becomes. Long periods of sideways trends are alternated with powerful bullish/bearish periods, and this indicator is ideally fitted to catch these moments.
Fractals
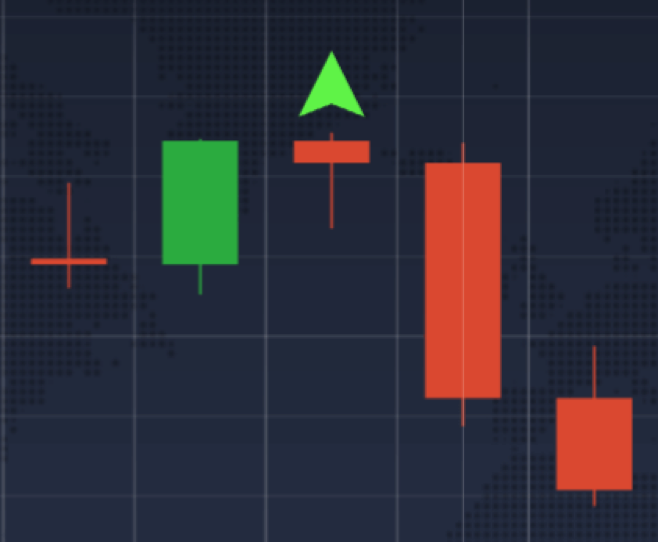
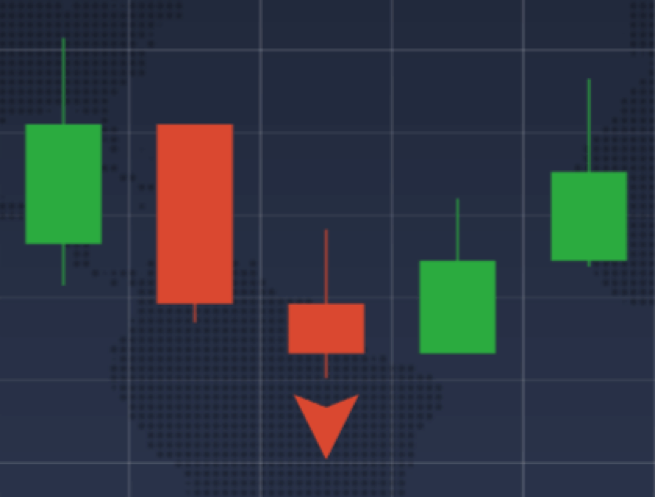
Fractals are applied to determine upcoming trends and hint at the emerging investing opportunities. There are two different forms of fractals:
1) A bearish reversal point appears if there is a pattern with the highest maximum in the middle and two lower maximums on each side.
2) A bullish reversal point appears if there is a pattern with the lowest minimum in the middle and two higher minimums on each side.
Setting up
It is pretty simple to set up the indicators on the IQ Option platform.
In order to set up Alligator, follow these steps:
1. Click on the “Indicators” button in the bottom left corner of the strade room
2. Go to the “Popular” tab
3.Then select “Alligator” from the list of possible indicators.
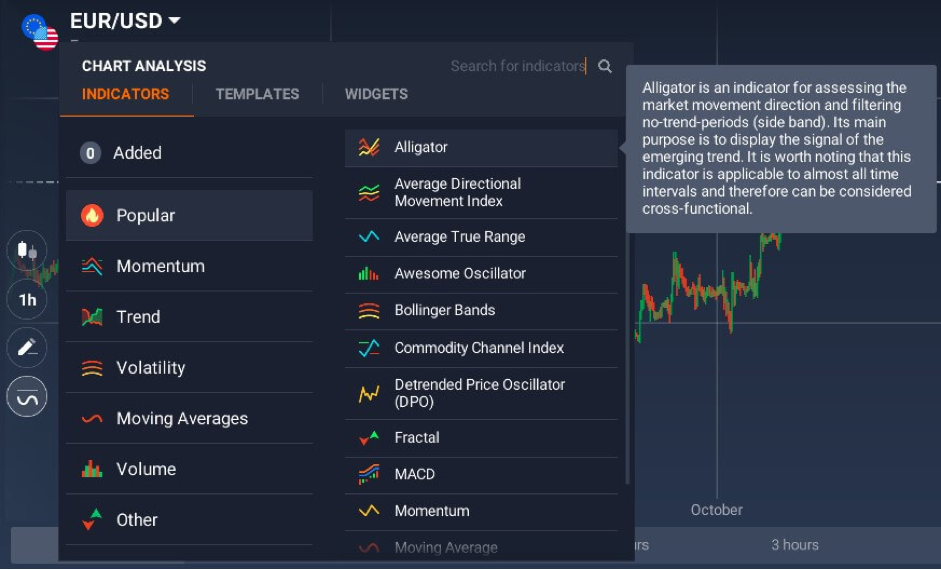
4. Don’t change the parameters and click the “Apply” button.
The Alligator chart will then be imposed on the price graph.
In order to set up Fractals, follow these simple steps:
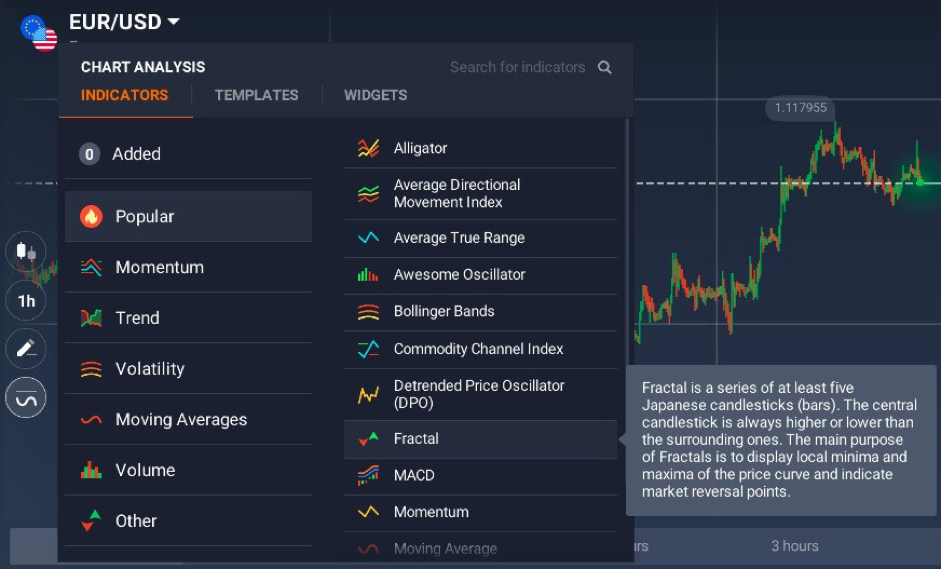
1. Click on the “Indicators” button in the bottom left corner of the trade room
2. Go to the “Popular” tab
3. Then select “Fractals” from the list of available tools.
3. Then select “Fractals” from the list of available tools.
4. Don’t change the parameters and click the “Apply” button.
Fractals will then be imposed on the price graph.
How to apply in trading?
Although each indicator may be applied on its own, Fractals and Alligator, as described by Bill Williams himself, work best if applied at the same time and approve each other’s signals. Commonly, all buy signals given by Fractals may be treated valid if only they are lower than the Alligator’s central line (orange). Likewise, all sell signals have to be higher than the Alligator’s central line (orange) to be valid.
Things to consider:
- Alligator and Fractals are trend following indicators, so they are lagging behind the actual market.
- It is likely to improve the accuracy of both indicators, if you increase the period. Nevertheless, the amount of formed signals will be lower.
- Signals have to be checked on various time intervals for maximum forecasting potential.
- The Alligator and the Fractals work best when applied at the same time. Applying only one of the them may be risky.
- Any indicator or trading system is not able to give precise signals all the time.
Leave a Reply