• Home
  • Trading Indicators
    • ADX Indicator
    • Alligator and Analysis
    • Fisher Transform Indicator
    • IqOption ATR Indicator
    • IqOption Awesome Oscillator
    • IqOption Bollinger Bands
    • CCI and MA
    • CCI indicator
    • Center of Gravity Indicator
    • Chande Forecast Oscillator (CFO)
    • Detrended Price Oscillator Indicator
    • Elliott wave principle
    • Fibonacci Lines
    • IqOption MACD Indicator
    • IqOption Indicator Moving Average
    • Parabolic SAR Indicator
    • Parabolic Stop and Reverse
    • RSI Indicator
    • RWI indicator
    • Stochastic lines
    • Stochastic Oscillator
    • Stochastic Power Trading
    • Support & Resistance
    • Technical Analysis
  • Trading Education
  • Make Deposit
  • Registration
  • Log In
  • Withdraw
  • Reviews
    • About Broker
    • Android App
    • iOS App
    • IQBroker
    • IqOption Affiliate program
    • Iq Option Careers & Work
    • IqOption in India
    • IQ Option Facebook
    • IQ Option Instagram
    • Is IQ Options safe?
    • Is Scam?
    • IqOption Mobile Application
    • Problem with Iqoption
    • Trading Features
    • Tips
    • Twitter
    • Why demo account?
    • USA traders
    • Vimeo
    • YouTube
  • F.A.Q
    • Account Verification
    • Android APK
    • Blocked and Closed account
    • Can i get profit?
    • Client Categorisation
    • Contacts & Support
    • Download
    • General questions
    • How to open demo
    • IQ Option Trading
    • IQ Option Wikipedia
    • Logout
    • Tournaments
    • IqOption Traders Account
    • Trading Fees
    • Withdrawal Process
  • Home
  • Trading Indicators
    • ADX Indicator
    • Alligator and Analysis
    • Fisher Transform Indicator
    • IqOption ATR Indicator
    • IqOption Awesome Oscillator
    • IqOption Bollinger Bands
    • CCI and MA
    • CCI indicator
    • Center of Gravity Indicator
    • Chande Forecast Oscillator (CFO)
    • Detrended Price Oscillator Indicator
    • Elliott wave principle
    • Fibonacci Lines
    • IqOption MACD Indicator
    • IqOption Indicator Moving Average
    • Parabolic SAR Indicator
    • Parabolic Stop and Reverse
    • RSI Indicator
    • RWI indicator
    • Stochastic lines
    • Stochastic Oscillator
    • Stochastic Power Trading
    • Support & Resistance
    • Technical Analysis
  • Trading Education
  • Make Deposit
  • Registration
  • Log In
  • Withdraw
  • Reviews
    • About Broker
    • Android App
    • iOS App
    • IQBroker
    • IqOption Affiliate program
    • Iq Option Careers & Work
    • IqOption in India
    • IQ Option Facebook
    • IQ Option Instagram
    • Is IQ Options safe?
    • Is Scam?
    • IqOption Mobile Application
    • Problem with Iqoption
    • Trading Features
    • Tips
    • Twitter
    • Why demo account?
    • USA traders
    • Vimeo
    • YouTube
  • F.A.Q
    • Account Verification
    • Android APK
    • Blocked and Closed account
    • Can i get profit?
    • Client Categorisation
    • Contacts & Support
    • Download
    • General questions
    • How to open demo
    • IQ Option Trading
    • IQ Option Wikipedia
    • Logout
    • Tournaments
    • IqOption Traders Account
    • Trading Fees
    • Withdrawal Process
Home » Trading Education

Support and Resistance: Trading Basics Tutorial


Support and resistance levels on IqOption are substantial levels on the asset graph that the price might retrace from. Trading on breakouts and trend reversals is a famous approach of selecting market entries.

Resistance and support lines are the most apparent technical analysis indicator. At least, you have to give them a chance since many investors and traders globally rely on them every day.

Contents

  • Support and resistance lines on the graph
  • Rebounds
  • Breakouts
  • Fakeout
  • Conclusion

Support and resistance lines on the graph

Horizontal line in the “Graphical Tools” menu

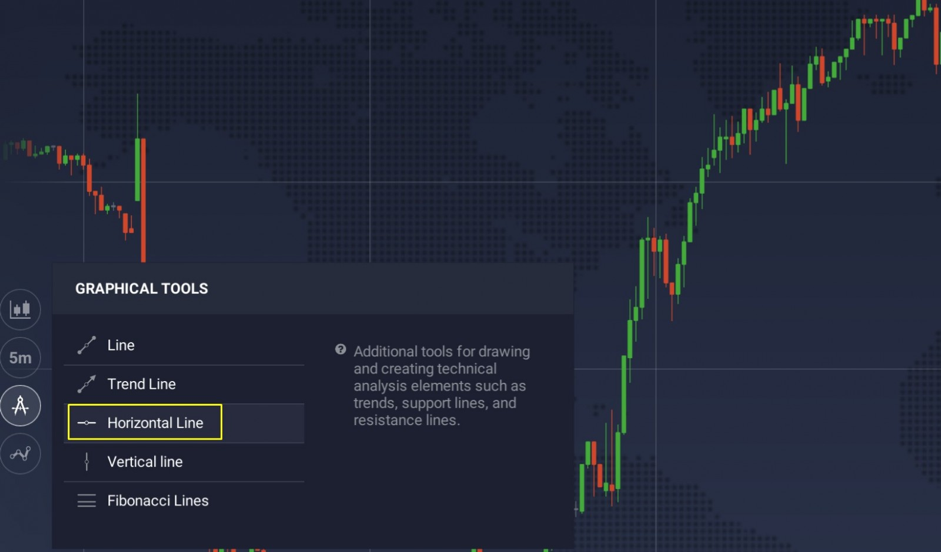
You can draw these lines on any type of graph: candlestick, bar, area or line. But like with other forms of technical analysis, they are the most visible on bar and candlestick graphs. Support and resistance levels may help traders find out at what point to buy an asset with a  decreasing price, and when to sell it.

As you may see, support and resistance levels mirror peaks and troughs on the price graph. These local price extremes are the basis of trading. They mirror the law of the financial market – the concept of supply and demand. Support and resistance levels are generated on the graph as bidders are driven by the price level which the price reached the last time. They don’t want to risk, and start getting rid of their ongoing positions at a safer level.

Traders who apply support and resistance levels have strategies in their trading system both for  breakouts of the level and rebounds from the level.

Rebounds

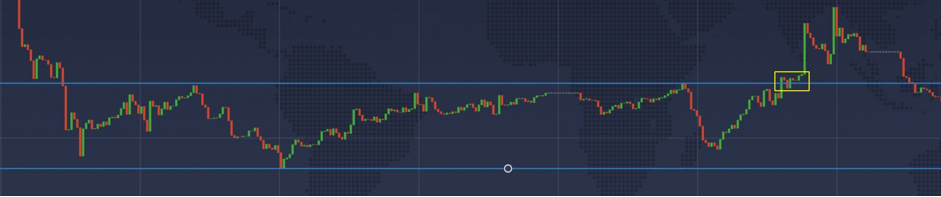
If the price comes closer to the levels from which it bounced back previously, it may rebound again, therefore, generating a price channel.

Rebounds
Rebounds

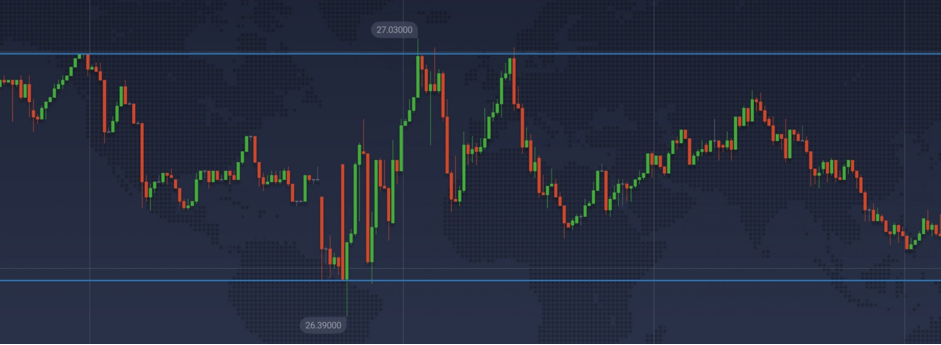
The picture above demonstrates the price movement in a flat with distinct thresholds. The upper limit of the flat acts as resistance for the market, and the lower limit acts  as support. Several traders consider the rebound as an entry opportunity, closing the trade when the price comes to the upper threshold.

Likewise, an entry point for selling is the moment of rebound from the level of resistance at the upper boundary, exiting the deal at the support level. Besides the horizontal levels of support and resistance, there are as well inclined levels. These are known as trend lines.

The trend line and the level of support generate a triangle

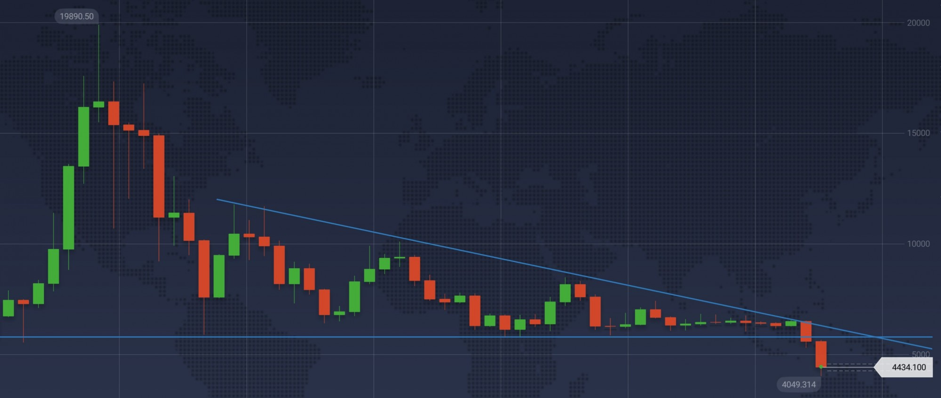
Trend lines hint at the direction of movements of the price. They are formed with the use of  the local highs of the negative trend and lows of the positive trend. Keep in mind that you may as well add horizontal levels on the price graph as a part of the overall strategy.

Possible entry points on horizontal levels

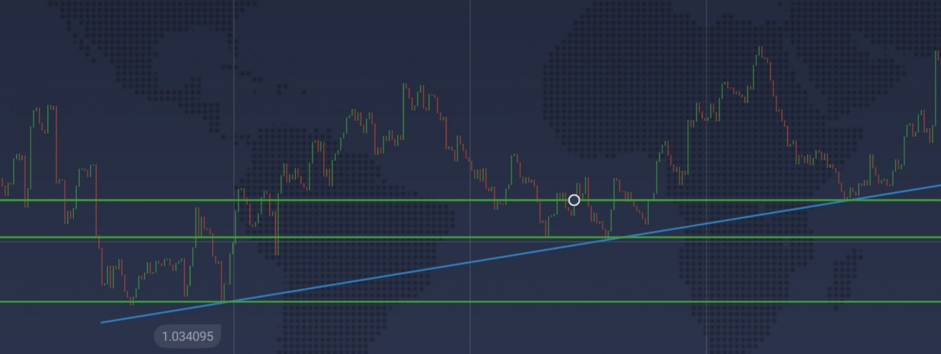
It is as well likely for an old resistance level to become a new support line (if the price of the asset moves up), and conversely for a negative trend price movement. Retracements in the direction of the trend may be considered as one of the signals. If the retracement is more powerful and the price breaks through the trend support, traders think about using a strategy in accordance with breaking out of the support and resistance levels.

Breakouts

Support and resistance breakouts occasionally give an opportunity to overcome a powerful trend. Keep in mind that this technique is more difficult to apply than the one mentioned before as the trader is required to monitor the market almost continually in order not to miss an entry point. Numerous traders who make use of the breakout do not enter straightaway, but wait for the retracement after the breakout, and only then enter the market.

Entering the market after a breakout retracement

Fakeout

Breakouts of the support and resistance levels may be real or fake. False breakouts regularly fool traders, because the price broke through the level and have to be on a good wave, but in the end exactly opposite happens – the price moves back behind the level and go in the opposite direction.

Fakeout
Fakeout

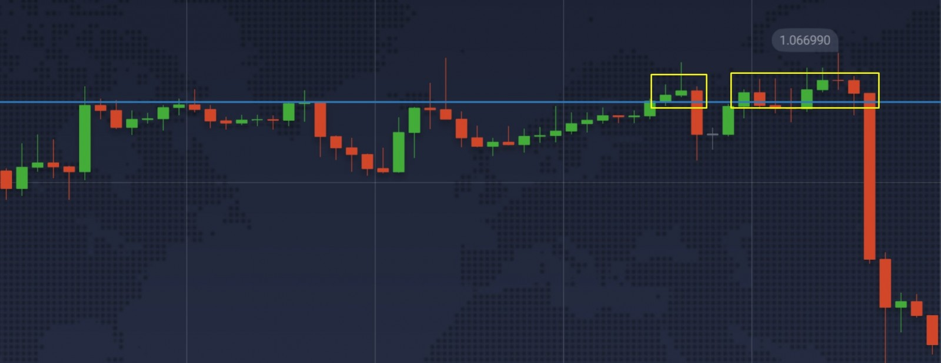
In this situation it is best to wait until the following candlestick closes after the break and evaluate the market situation. When the price returns back after the breakout and the candlestick is formed opposite to the breakout, then this is most likely a fakeout.

In case of a true breakout of the trend, a number of traders consider entering with the retracement after the breakout.

Conclusion

Trading on support and resistance levels make use of of the psychology of the masses – market members concentrate on how the price behaved in an identical case previously. They determine the maximum and minimum prices over the ongoing time period (for instance, over the past week), and estimate events which happened throughout this time or which may happen in the near future. If the initial information associated to the asset does not suppose any violations and there are not any events which would influence the asset more than in the past week, it is reasonable to suppose that the price will stay in the same corridor moving forward.

In order to trade applying this approach, you have to learn how to build support and resistance lines and watch the background news for the purpose of avoiding running into a sudden breakout. Keep in mind that any technical analysis instrument cannot be 100% precise, because all of them may give false signals.


Read Next

Market Sentiment - IqOption Mass Psychology for Successful Traders

Leave A Reply

Leave a Reply

Your email address will not be published. Required fields are marked *

  • Pages

    • About us
    • Account Verification
    • ADX Indicator
    • Android APK
    • Can i get profit from Iq Option?
    • CCI and MA
    • CCI indicator
    • Center of Gravity Indicator
    • Chande Forecast Oscillator (CFO)
    • Contact us
    • Contacts & Support
    • Detrended Price Oscillator Indicator
    • Download
    • Elliott wave principle
    • Fibonacci Lines
    • Fisher Transform Iq Option Indicator
    • General questions
    • How to open demo
    • Iq Option Careers & Work
    • IQ Option Facebook
    • IQ Option Instagram
    • Iq Option iOS App
    • IQ Option Trading
    • IQ Option Wikipedia
    • IQBroker
    • IqOption – Client Categorisation
    • IqOption – Twitter
    • IqOption – YouTube
    • IqOption Affiliate program
    • IqOption Alligator and Analysis
    • IqOption Android App / Google Play
    • IqOption ATR Indicator
    • IqOption Awesome Oscillator
    • IqOption Blocked and Closed account
    • IqOption Bollinger Bands
    • IqOption in India
    • IqOption Indicator Moving Average
    • IqOption MACD Indicator
    • IqOption Make Deposit
    • IqOption Mobile Application
    • IqOption Reviews
    • IqOption Traders Account
    • IqOption Vimeo
    • Is IQ Options safe?
    • Is Scam?
    • Log In
    • Logout
    • Online Trading Broker Review
    • Parabolic SAR Indicator
    • Parabolic Stop and Reverse
    • privacy policy
    • Problem with Iqoption
    • Registration
    • RSI Indicator
    • RWI indicator
    • Search Results
    • Stochastic lines
    • Stochastic Oscillator
    • Stochastic Power Trading
    • Support & Resistance
    • Technical Analysis
    • Tips
    • Tournaments
    • Trading Features
    • Trading Fees
    • USA traders
    • Why demo account?
    • Withdraw
    • Withdrawal Process
  • Recent Posts

    • Balance of Power – Identifying Market Sentiment
    • How to Capitalize on IqOption Marijuana Stocks?
    • How to Measure Risk?
    • IqOption Beginner’s Guide
    • How to Trade a IqOption Falling Asset? Two Rules by Jeff Clark
    • What Time Frame to Trade on IqOption?
    • Improving Your Trades in 5 Simple Steps
    • What Is a Trading Journal and Why Do You Need One?
    • Highest High, Lowest Low – 2 IqOption Indicators That Are Meant for Each Other
    • Why Traders Lose with IqOption? Trading Mistakes You Don’t Want to Make
    • Psychological Line Indicator: Trading Strategy and Tips
    • Trading on IqOprion with Vortex Indicator
    • Market Sentiment – IqOption Mass Psychology for Successful Traders
    • Support and Resistance: Trading Basics Tutorial
    • What Kind of Trader Are You?
    • How to Trade with Parabolic SAR in the Most Effective Way
    • Alligator and Fractals: a Powerful Combination of Technical Indicators
    • 6 Things Every Trader Should Know
    • A Trading Strategy for Everyone – The Bladerunner
    • Why You Should Keep a Trading Journal
    • How to open a trading position automatically
    • Guide to the Bearish Engulfing Candlestick Pattern
    • Why won’t You Make Money Trading Options on IQ Option?
    • Ichimoku Cloud: How to Use Indicator in Trading?
    • Master Stop-Loss and Take-Profit on IqOption Feature
    • 8 Risk Management Tips from the World’s Top Traders
    • Financial Crisis & Trading on IqOption
    • Easy Way to Open Deals on IqOption Automatically
    • Developing a Trading Strategy of Your Own
    • Commodity Channel Index (CCI)
    • Iq Option review
    • Relative Strength Index (RSI) in IqOption
    • Business and Trading
    • John Murphys Laws of Technical Trading
    • Bollinger Bands Width & Unique Volatility Indicator
    • Elder Impulse System
    • Trading with a Multiplier
    • Fundamental vs Technical. What Analysis Type to Choose on Iq Option?
    • Using Stochastic Oscillator in Trading
    • 5 Day Trading Tips
    • Nasty Trading Mistakes That You Probably Make on Iq Option
    • What to do when the market is flat on Iq Option?
    • Trading on Iq Option with Alligator – a trend-craving carnivore
    • Awesome Iq Option Platform Features You’ve Probably Never Heard Of
    • Indicator Templates – Apply All Favorite Iq Option Indicators in 2 Clicks
    • Five Don’ts of Trading — Keep These Things Away with Iq Option
    • Technical Analysis. How Does It Work on Iq Option?
    • Schaff Trend Cycle — Indicator Tutorial on Iq Option
    • Customizing the Iq Option Platform for Optimal Trading Experience
    • Trading with Iq Option QStick Indicator
    • Trading Psychology: 5 Tips to Improve Discipline on Iq Option
    • What Indicators to Use for Iq Option Day Trading?
    • Iq Option Risk Management Basics: The 2% Rule
    • 5 Trading Proverbs – Timeless Wisdom for Iq Option Traders
    • Trading with Williams’ %R on Iq Option
    • Strangle plan Volatility of the Tame Market and Classic Options
    • Trading On News with Iq Option broker
    • Iq Option Trading Education
    • Options Types on Iq Option
    • FX Options
    • Iq Option Digital Options
    • Classic Options
    • Cryptocurrency on Iq Option
    • About Iq Option Binary Options
    • Earning and Investing in Iq Option
    • Traits Successful Iq Option Traders

  • Search


  • Home
  • About us
  • Contact us
It's not an official website of IQ Option. This material is not intended for viewers from EEA countries. Binary options are not promoted or sold to retail EEA traders. © Copyright iqoptions.net - “General Risk Warning: The financial products offered by the company carry a high level of risk and can result in the loss of all your funds. You should never invest money that you cannot afford to lose”
Press enter/return to begin your search