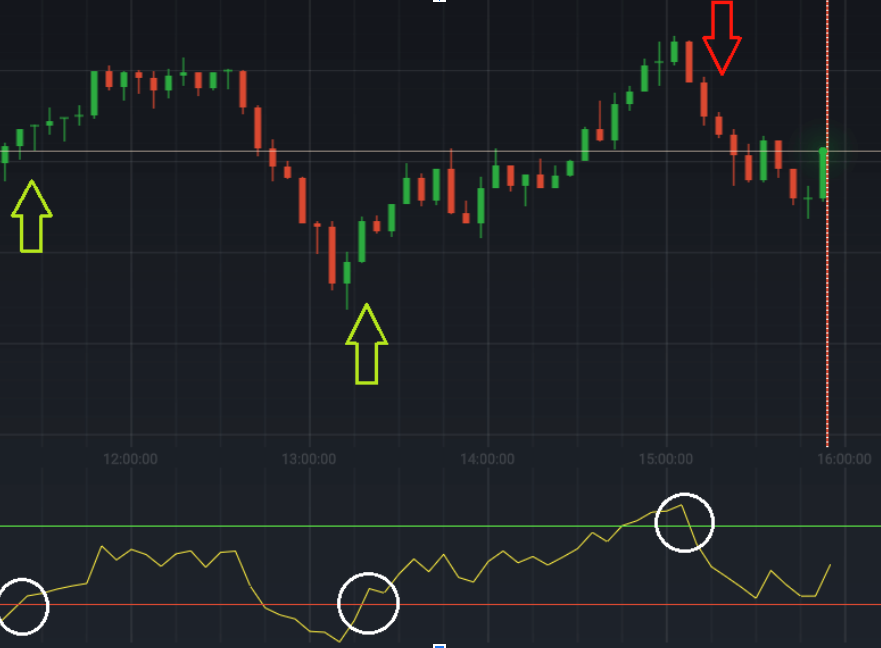
The relative strength index (RSI) is a momentum oscillator used to estimate the velocity and magnitude of the price direction movements. The indicator may help you identify overbought or oversold levels, it can also give buy and sell signals.

The Relative Strength Index is actually a single line that moves on the scale between 0 and 100. If the line comes closer to zero mark, the chances that the asset will be oversold, become higher. If the line comes closer to 100, the asset is expected to be overbought.Based on the indicator, the price of the asset is believed to increase when it is in the oversold zone and decrease when it is in the overbought zone.
How to use it in trading?
As it was mentioned above, the RSI indicator fluctuates between 0 and 100%. Generally, the RSI is considered to be oversold when below 30% and overbought when above 70%. If the RSI indicator gives many false alarms it is possible to increase the overbought boundary to 80% and decrease the oversold barrier to 20%.

Moreover, J. Welles Wilder, famous technical analyst, used a smoothing period of 14, that definitely may be changed in order to adapt for short- and long-terms strategy. Shorter or longer periods are used for alternately shorter or longer perspectives.
The RSI is a universal indicator and may be used in order to trade any asset and any time frame.
Keep in mind that when there are strong trends, the Relative Strength Index may stay in the overbought or oversold zones for a really long time! other thant, you should remember that the RSI just like any other indicator is not able to give exact readings all the time.
Settings and Configurations
For the purpose of using the RSI indicator, you should follow these steps.
- Click on the “Indicators” button in the bottom left corner once you are in the trade room
- In the “Popular” tab, select the “RSI” from the list of available indicators
- then press the “Apply” button if you want to leave the default settings. The RSI graph will appear in the bottom part of your screen
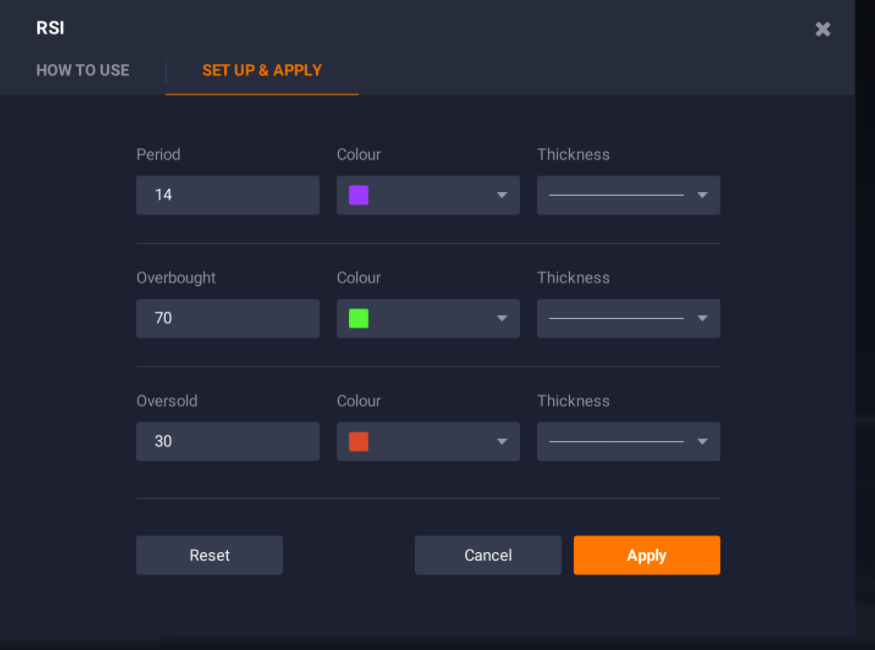
- Professional traders might find it helpful to take another additional step and go to the “Set up & Apply” tab.
It is not mandatory to change the default settings. When you set up the RSI indicator, you may change the period, oversold and overbought levels in order to achieve higher accuracy or sensitivity. Keep in mind that if the corridor is wider, you will get less signals , but at the same moment they may be more exact. Vice versa if the boundary levels are closer to each other: the crossover signals will be sent more frequent, but the number of false alarms will grow as well. Not that if you increase the “Period” parameter you will make the indicator less sensitive.

Standard approach — 70/30
In the standard method the smoothing period of 14, overbought level 70% and oversold level 30% are used. This is the most commonly used preset for the RSI indicator. Traders await when the RSI will bounce off 30 and 70 boundary lines. With standard settings this is expected to be frequently, but it doesn’t always mean that the actual change in the trend direction is going to happen.
Conservative approach — 80/20
In the conservative method the smoothing period of 21, oversold level 20% and overbought level 80% are used. Investors, who avoid risk, set up the indicator so that the Relative Strength Index is less sensitive and thus it lowers the amount of false signals. More extreme maximums and minimums levels, 90 and 10 are not used commonly, but show stronger momentum.
Divergence
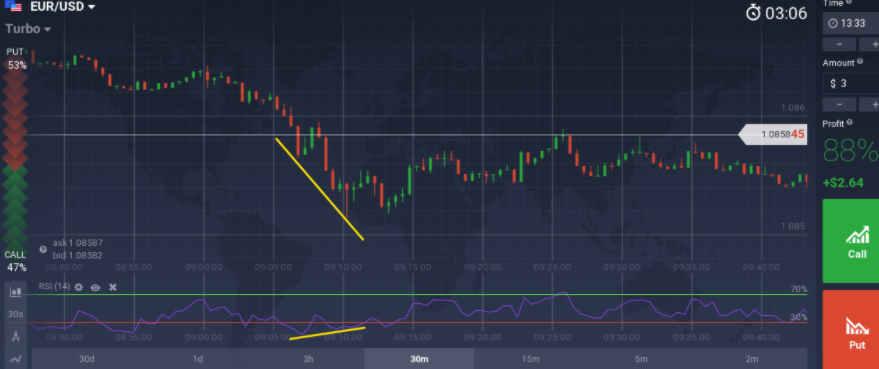
Divergence is another way how you can use the RSI indicator. If the movement of the underlying prices is not approved by the RSI it may indicate a trend change

Divergence may be a great indicator of an upcoming price shift. In the example above the price of the asset falls, while the RSI indicates the opposite movement and it is expected that the trend change will occur.
Conclusion
The RSI is a strong tool that may help you identify the best entry and exit points. Moreover, from time to time the RSI may forecast the trend and other indicators can be too slow in order to do that. Nevertheless, usually it is not used individually and it is used together with other indicators like the Alligator or Bollinger Bands. Now that you know how to start using it in trading, you can go to the platform and try it!
Leave a Reply