What is IqOption Parabolic SAR Indicator?
In the late 1970’s, Welles J. Wilder came up with the concept for what is known today as Parabolic SAR, one of many technical analysis indicators developed and introduced by this famous technical analyst. SAR in the name of this indicator is short for “stop and reverse”, and it is used to follow price action movement over time. It is located under the price when it’s going up, and above the price when they are plummeting.
Being one of the more basic indicators, Parabolic SAR is usually incorporated into all major trading platforms. Traders use this indicator so to inform about the potential changes in the trend. Although Parabolic SAR is one of a kind indicator with unique working potential, it is always advisory to use it alongside other indicators. This combined use serves to ensure highest possible degree of accuracy.
How does iqoption SAR indicator work?
The principle of Parabolic SAR is not that complicated really. The indicator uses moving dots to show the trend direction. When the price meets one of these dots, the indicator usually goes over to the other side of the price line. Trend reversal or leastwise a slowdown is expected to follow.
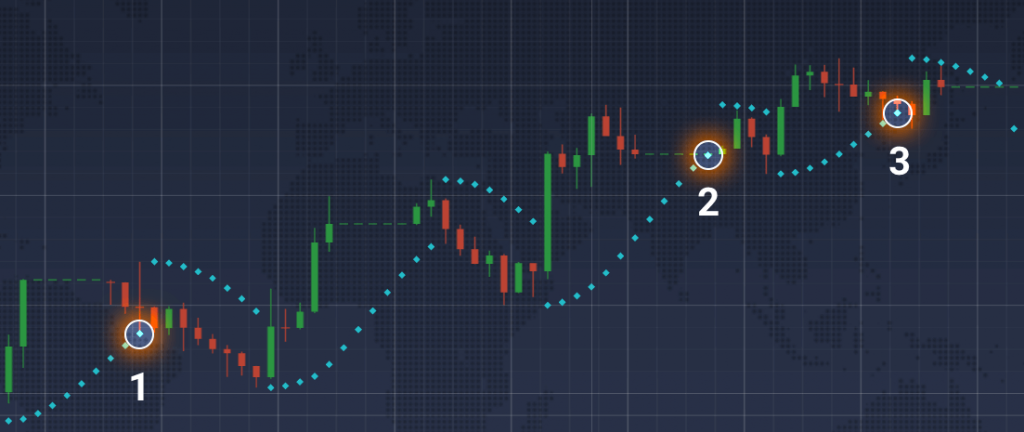
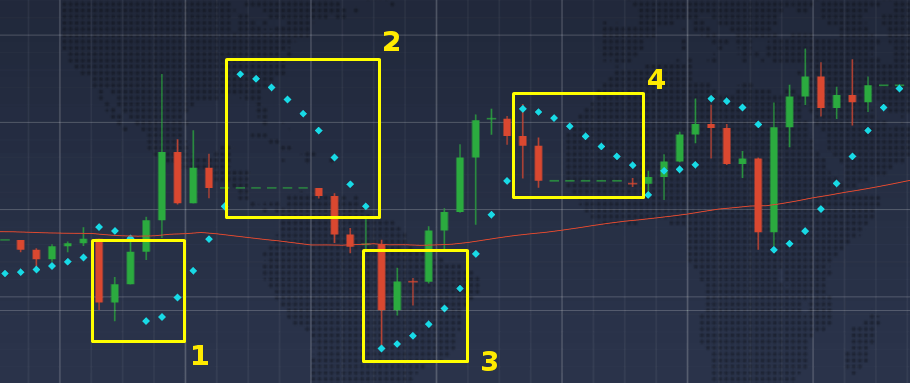
The Parabolic SAR can predict trend reversals, as illustrated by situations 1, 2, and 3
From the attached picture you can see that as soon as the indicator connects with the price line, the trend starts moving in the other direction. This is good as it shows the optimum buy/sell points to traders. It can also forecast the direction trend takes, and tell about price action behavior in the future.
How to set up Iqoption Parabolic SAR?
Setting up this indicator in the IQ Option platform is not that difficult. Click on the “Indicators” icon located in the bottom left of you window. Then you will see all the possible indicators you can choose from. Click on “Parabolic SAR” from the list.
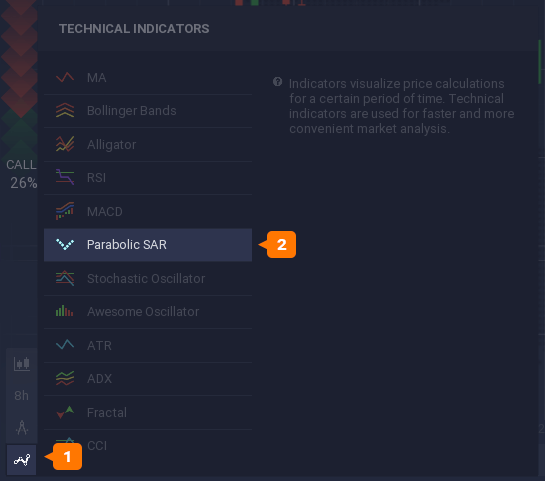
Setting up the indicator – step one
If you want to use the indicator with default settings, just click “Apply”. You also have the option to configure the parameters with the “Set up & Apply” tab.
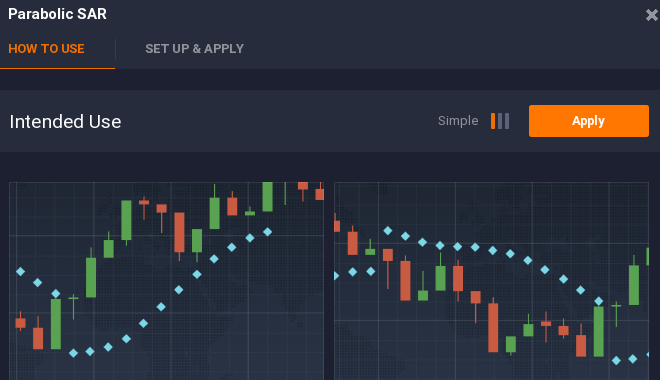
Parabolic SAR with default settings
“Set up & Apply” tab offers you to calibrate parameters such as acceleration and acceleration max. By increasing these parameters, the indicator becomes more responsive, but also less precise. On the other hand, lowering the numbers of these parameters makes Parabolic SAR more resilient, but way more precise. That’s why it is important for traders to find the right balance when changing these settings to ensure the maximum effectiveness of the indicator.
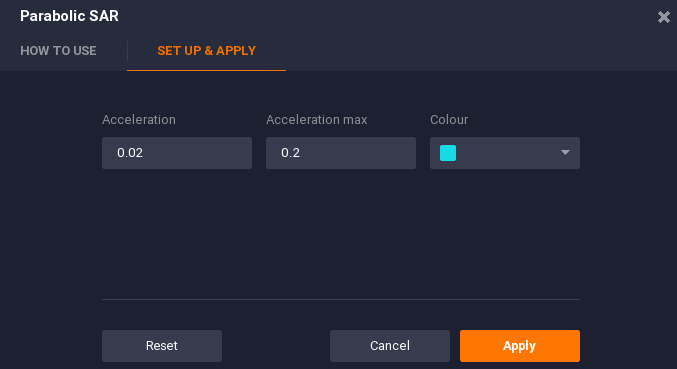
Calibrating the acceleration and acceleration max parameters in the “Set up & Apply” tab
How to effectively Use Iqoption Parabolic SAR?
The author himself noted that Parabolic SAR should be used only with strong trends that usually do not exceed 30% of the time. This is important, because in the times when there are short time intervals and sideways movement, the indicator may not be as precise and effective. Avoiding the use of Parabolic SAR in these circumstances minimizes the risks.
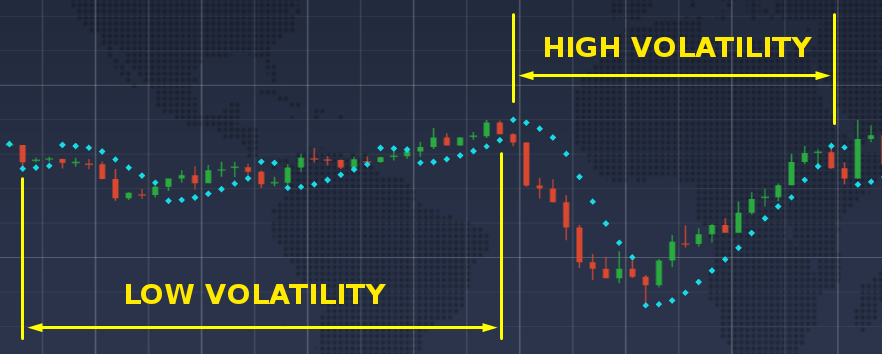
Low volatility makes the indicators way less precise, but periods of high volatility make it perfect for use
Now we will talk about possible combinations of Parabolic SAR and other indicators. One of the most used combinations include merging Parabolic SAR and Simple Moving Average. It is always advised to check Parabolic SAR signals using other indicators as well.
Combining Iqoption Parabolic SAR and SMA
One of the best known tactics that traders use is merging Parabolic SAR and Simple Moving Average. When set up to 0.04 acceleration and 0.4 acceleration max, and SMA set up to 55 periods, these two work to verify each other’s signals. This signal anticipation can go to ways: bullish trend or bearish trend. Let’s go over them now:
Anticipating the bullish trend
Waiting for the price to drop under the SMA line and when Parabolic SAR shows upward direction, the trend usually goes upward (bullish).
Anticipating the bearish trend
Predicting bullish and bearish trends with a combination of the Parabolic SAR and the SMA
On the other hand, when the price goes over the SMA line and the Parabolic SAR goes in the downward direction, the trend usually goes downward (bearish).
Both circumstances are displayed on the attached picture. For situations 1 and 3 it’s a good investment opportunity, while situations 2 and 4, indicates that the trend is very likely to go downward.
Leave a Reply