MACD stands for Moving Average Convergence / Divergence and it is a trend-following momentum indicator on iqoptions
What is MACD indicator? How to use MACD indicator on IqOption?
Although simple, it is considered one of the most powerful momentum oscillators developed to this day. Its creator, Gerald Appel, introduced it the late 70’s.
How does IqOption MACD work?
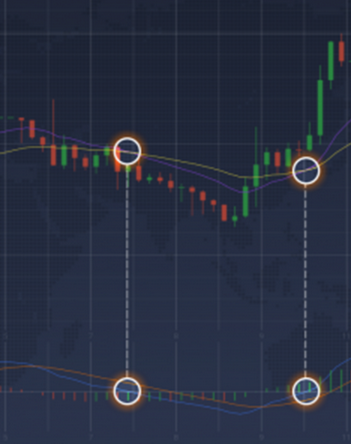
MACD indicator is perfect for showing the optimal entry and exit points. It gives correlated signals at the start and the end of the trend.
IqOption Fast and slow lines
Grasping the concept of MACD indicator may look harder than it really is, but it’s not that difficult after all. To make moving average convergence/divergence more understandable, let’s turn to EMA (exponential moving averages) with the periods of 12 and 26.
The MACD is an instrument based on the EMA lines By looking at the attached picture above you can notice the following things:
The crossover of the moving average lines on the chart is relative to the crossover of the fast MACD line (shown in blue) and the horizontal zero line. From here, MACD value can be determined as the difference between exponential moving averages with corresponding periods. Slow MACD line (shown in orange) represents the average of the fast MACD line (blue).
IqOption Green and red bars
It is also noticeable that there are green and red bars following the length of the MACD lines.
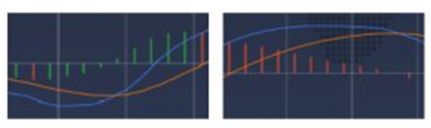
The green and the red bars are showing the distance between the slow and the fast MACD lines. Green bars will appear in the MACD window when:
1. The blue line is above the orange line and the distance between the lines is getting larger; 2. The blue line is below the orange line and the distance between the two lines is getting smaller. Red bars will appear in the MACD window when: 1. The blue line is below the orange line and the distance between the two lines is getting bigger; 2. The blue line is above the orange line and the distance between the two lines is getting smaller.
As you can see, following these bars is pretty simple once you know the concept behind them. You can also look at it this way: when the blue line moves up faster or moves down slower than the orange line, you will see green bars. Other way around, and there will be red bars displayed.
MACD Settings for IqOption Day Trading
For use in day trading, all you need to do is find the “Indicators” icon in the bottom left corner of the window. A list with indicators will drop. Select MACD from this list.
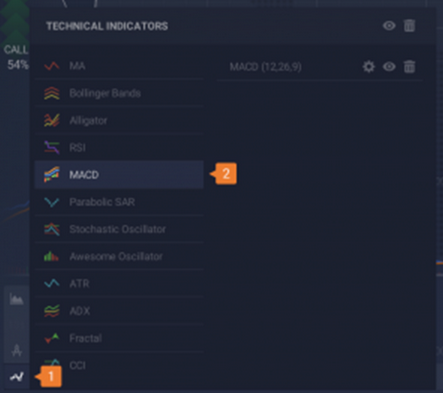
Setting up the indicator – Step one
From here you can adjust the parameters how you prefer. If you wish to use MACD with default settings, just click “Apply”.
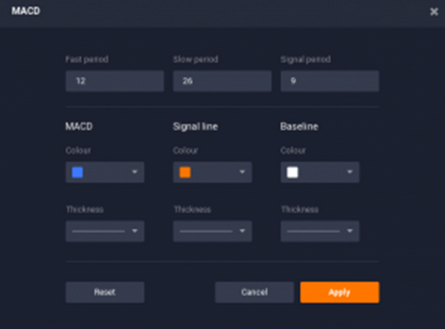
Setting up the indicator – Step two
The indicator’s sensitivity can be escalated by decreasing the fast period and increasing the slow one.
How to Use MACD in Day Trading?
MACD is applicable in multiple ways in day trading and we will go over them now.
IqOption Signal line crossovers
When the blue line crosses over the orange line and continues going above it, usually an uptrend is about to follow. Fast line crosses under the slow line indicates, however, a downtrend.
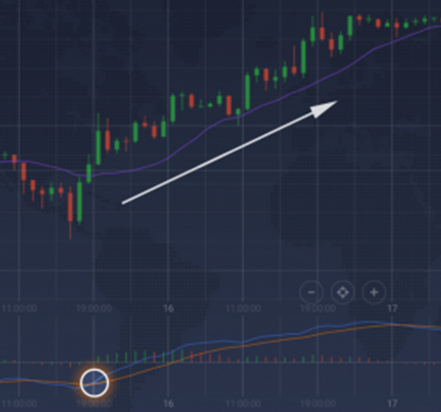
Signal line crossover as an indicator of the uptrend
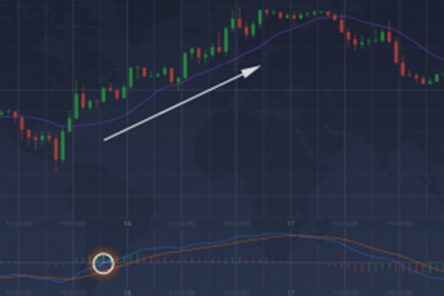
Centerline crossovers
An uptrend awaits once the blue line moves above the zero line and becomes positive. Alternatively, a downtrend is expected when the blue line moves below the zero line and becomes negative.
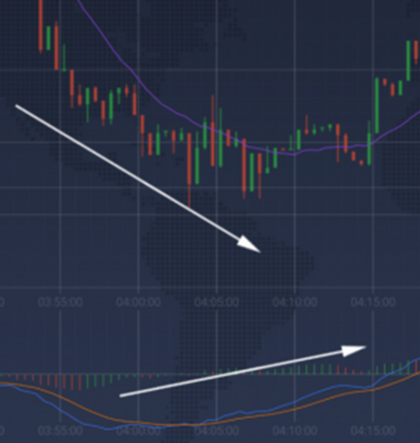
Divergences
Divergences happen when the price chart and the MACD chart start going in the opposite directions. When security shapes a lower low and the MACD forms a higher low is what is referred to as a bullish divergence. A bearish divergence on the other hand forms when a security records a higher high and the MACD forms a lower high. Divergence can indicate an upcoming trend reversal.
MACD indicator serves to follow the trend and indicate momentum at the same time. The thing that makes it a universal trading tool is that it can be applied to both short and long time intervals.
Leave a Reply