Ichimoku Cloud, which is as well called as Kinko Hyo, is a technical analysis tool and it is a trend-following indicator. The main purpose of Ichimoku Cloud, just like any other trend-following indicator, is to determine the direction and reversal points of the current market trend. Moreover, there is another purpose this indicator has. Because Ichimoku is universal, it may as well be used as an oscillator
Being quite versatile, Ichimoku can also work as an oscillator. In other words, it measures the speed of the price change for the specific asset. In addition, Ichimoku is is able to determine support and resistance levels. Ichimoku may become a good basis for your trading strategy. In this article we will explain how you can set it up and use the indicator in trading.
How does it work?
In order to get a clearer image of what this Ichimoku Cloud is , we will separate it in 5 elements Every element is a different type of a moving average.

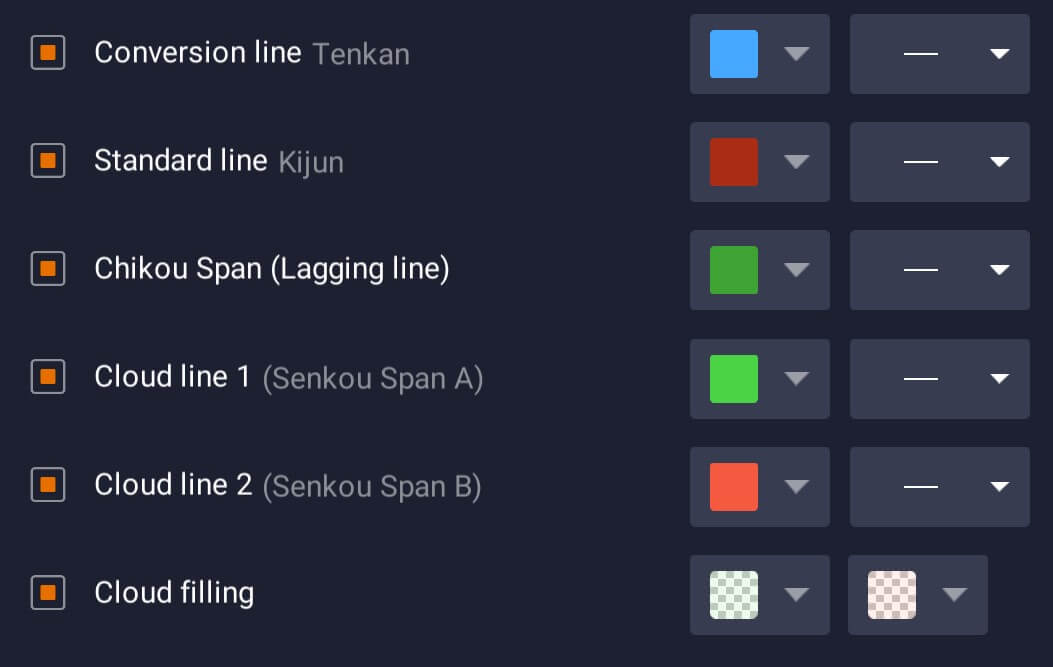
The conversion line Tenkan (blue-colored line) and the standard line Kijun (red-colored line) are as well known as equilibrium lines. The conversion line (blue) averages the highest maximum and the lowest minimum for the last 9 periods. It can indicate the trend change when there is an intersection with the standard line (red). To compare, the standard line averages the highest and lowest values for the last 26 periods. It appears to be a dynamic support and resistance level.
Senkou Span A and Senkou Span B moving averages create the “cloud”. Senkou Span A averages the two equilibrium lines and moves the obtained values 26 periods forward. Senkou Span B averages the highest maximum and the lowest minimum for the last 52 periods, moving the outcomes 26 periods ahead.

The so-called cloud, formed by the two lines
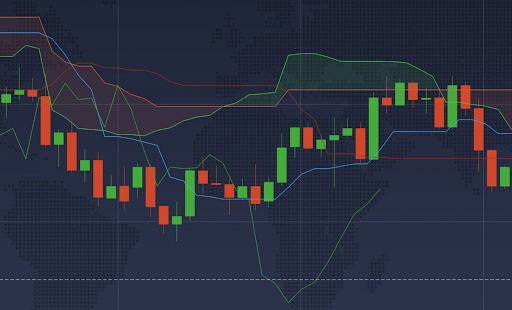
In between Senkou Span A and B creates a shaded area on the chart. It is a cloud, which changes color from green to red and conversely every time these two thresholds have an intersection with each other. If the cloud becomes green, a bullish trend is expected to appear. Vice versa, if the color turns to red, a bearish is considered to appear. If the trend change is likely, the cloud changes its color. The market volatility can be shown by the vertical distance between the boundaries of the cloud.
Lastly, the Chikou Span, a green line, shows the closing price of the ongoing candle, which is moved back by 26 periods. This lagging moving average is used as a supportive tool, that approves other signals, received by this indicator.
How to set up?
It is easy to set up Ichimoku Cloud, follow these steps in order to do that:
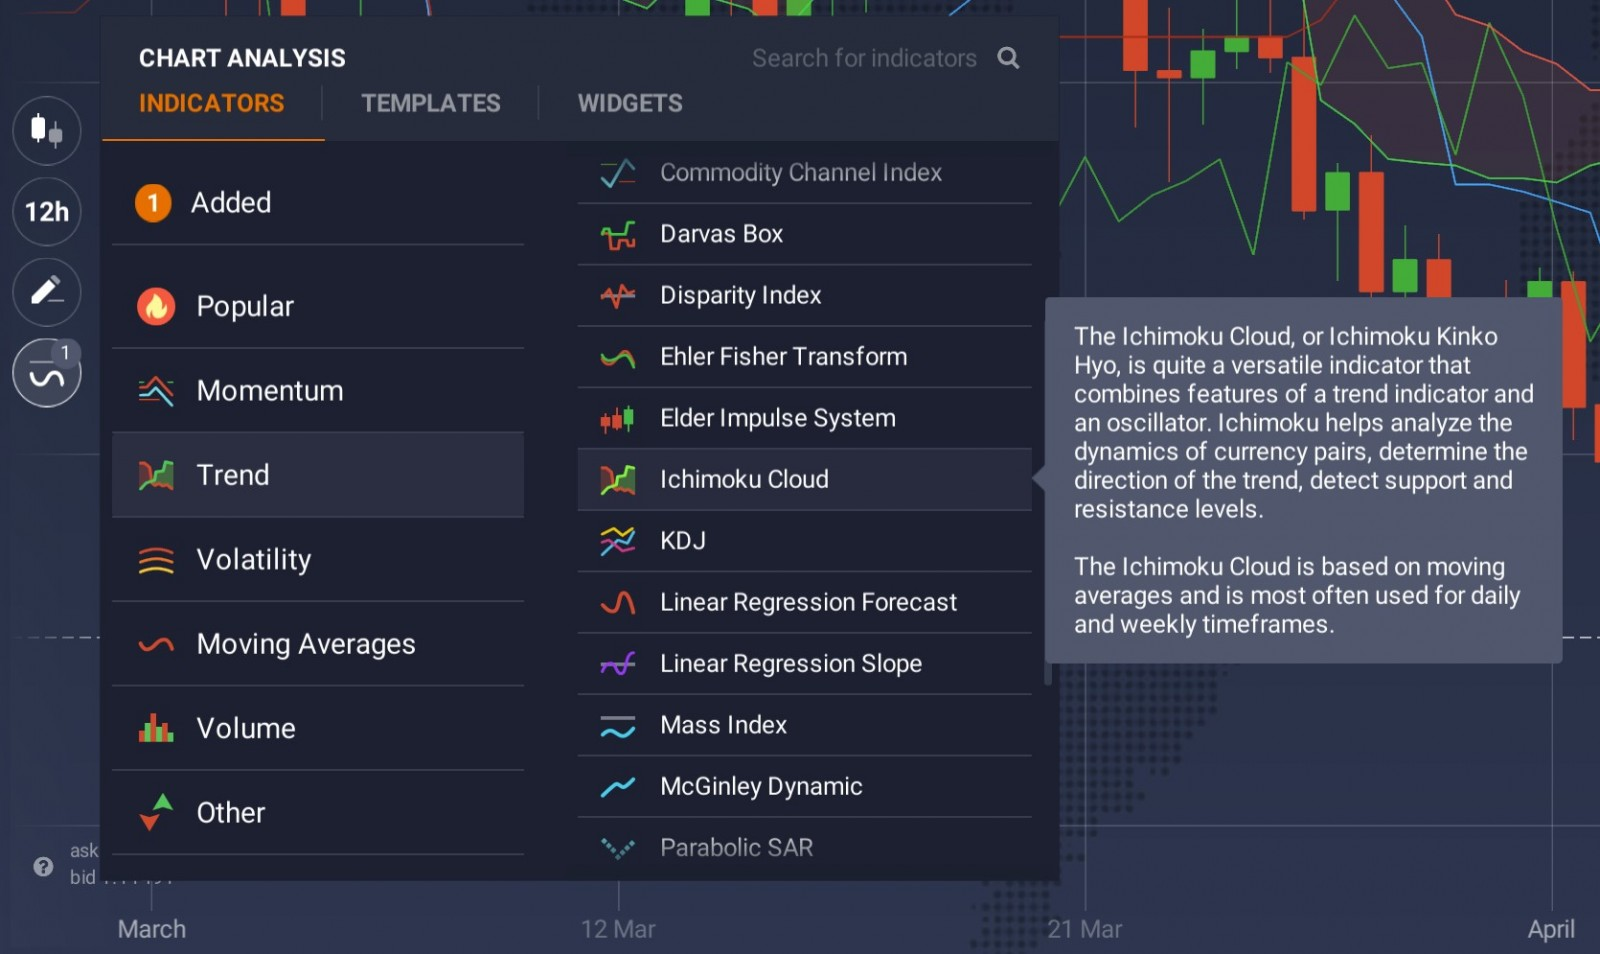
1. Click on the “Indicators” button in the left bottom corner when you are in a trade room.
2. Go to the ‘Trend’ tab
3. Select Ichimoku Cloud from the list of available options
4. Don’t change the settings and click “Apply” button

Now you can use Ichimoku cloud! You change the default settings of this indicator or you can remove the indicator from the chart if you go back to the ‘Indicators’ menu. However, if you are a novie trader it is better not to change the default settings, until you master the use of this indicator.
Trading signals
Considering all factors, when candles are higher than the cloud, according to Ichimoku Cloud, it is expected to have a bullish trend. When the cloud changes color from red to green, the candles go higher the Kijun base line, and the Tenkan conversion line goes higher than the baseline, an indicator is demonstrating that the market can be changed to a bullish. Vice versa, according to Ichimoku Cloud, when the candles are lower than the cloud, a bearish trend is considered to appear. When the cloud changes from green to red, the candles go lower than the Kijun base line, and the Tenkan conversion line goes lower than the baseline, an indicator is demonstrating that the market can be changed to a bearish. Experienced traders usually use Ichimoku Cloud together with other indicators in order to have a more accurate analysis. Yet, it may as well be used individually.
Leave a Reply