Iqoption ADX indicator
ADX (Average Directional Index) is an indicator that is used to measure strength of the trend on iqoption. Alongside minus directional indicator (-DI) and the plus directional indicator (+DI), it forms a group of directional movement indicators that are used to effectively measure both the strength and direction of the trend.
This technical analysis tool was developed by a famous technical analyst Welles Wilder in 1978. Today, ADX is widely used and applied in stocks. The indicators are effective in pinpointing strong trends and profitable entry and exit points.
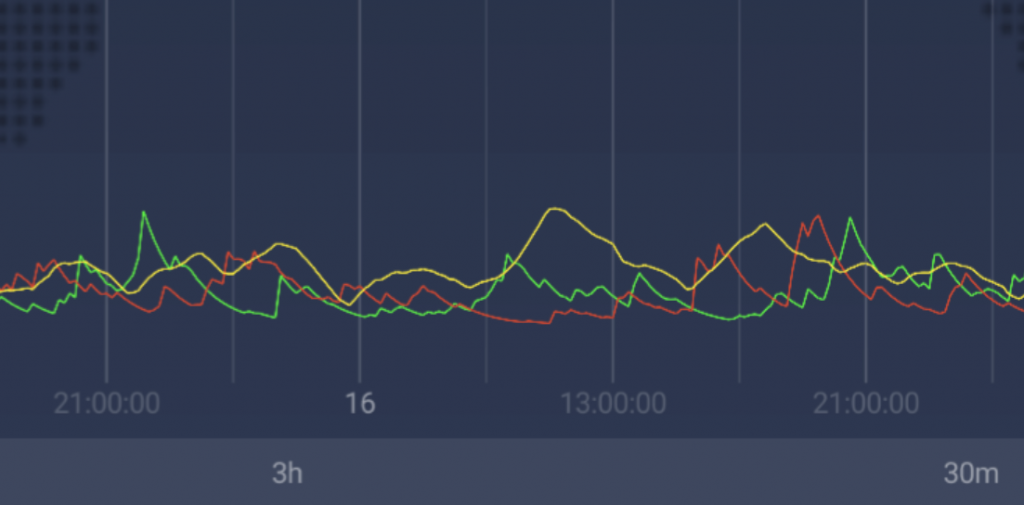
ADX as displayed in the IQ Option trading platform.
The logic behind ADX with IqOption
Basically, ADX answers the key question of how strong the current trend is. Its sole purpose is to measure the trend direction and strength.
ADX works together with two other indicator lines, the positive directional indicator (+DI – green line) measuring the strength of the uptrend, and the negative directional indicator (-DI – red line) that follows the intensity of the downtrend. From here, the ADX is obtained by the smoothed averages of the difference between +DI and –DI, providing results about the strength of the trend over time.
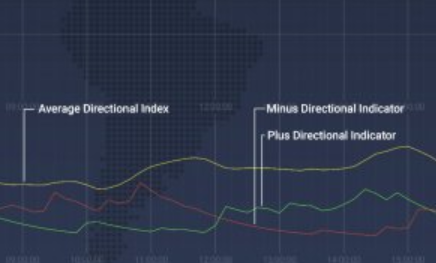
Three major lines forming the index.
Positioning of the directional indicators can show whether the bulls or the bears are strongest on the market. When the +DI is spotted above the -DI, bulls have the directional edge. On the other hand, when the -DI is displayed higher than the +DI, the directional edge belongs to bears.
Only when used together, these three trend indicators can show both strength and direction of the trend. ADX (yellow) all by itself does not indicate direction or momentum of the trend, by only portrays the trend strength, while +DI and -DI show the trend direction.
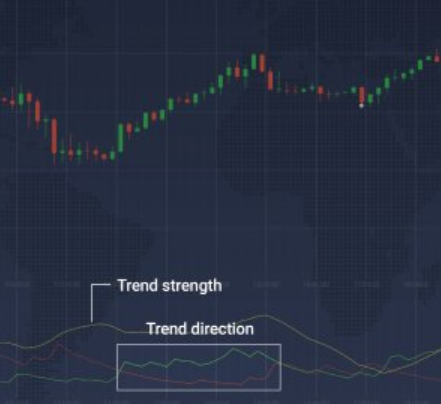
ADX line shows trend strength, +DI and -DI lines show trend direction.
Setting up indicator ADX on IqOption
It’s pretty easy to set up ADX in the IQOption platform.
By clicking on the icon “Indicators” on the left bottom part of the screen, you will see a list for all the possible indicators you can choose from. Pick ADX from this list.
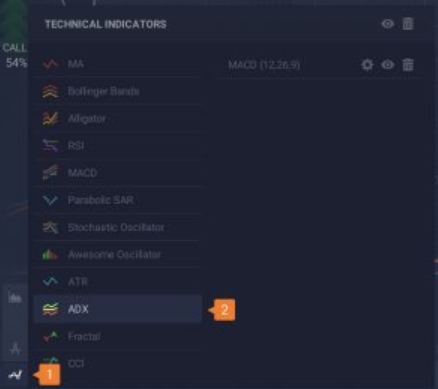
Step one.
From here you go to “Set up & Apply” tab where you can adjust the settings as you wish. If you would like to use the default parameters just click “Apply” and you are good to go.
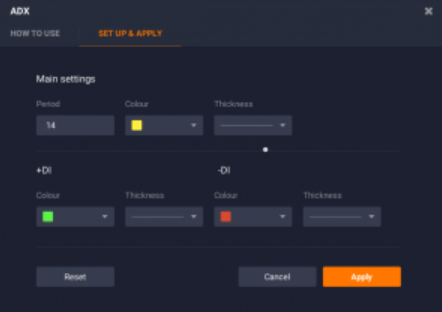
Step two.
The ADX indicator is now ready for use.
How to use ADX in iqoption trading?
There are a couple of different applications for the ADX indicator:
1) DI Crossover
Sometimes what will happen is that the -DI and the +DI lines will cross. This indicates that the trend is reversing. This is very valuable in determining optimal entry points. It signals investors to do the following:
– Enter the market when +DI > -DI since the general trend is moving upwards.
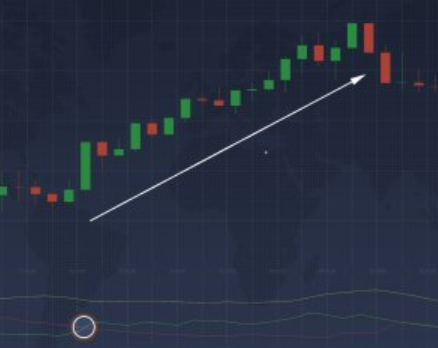
+DI and -DI bullish crossover.
– Leave the market when +DI < -DI since the general trend is moving downwards.
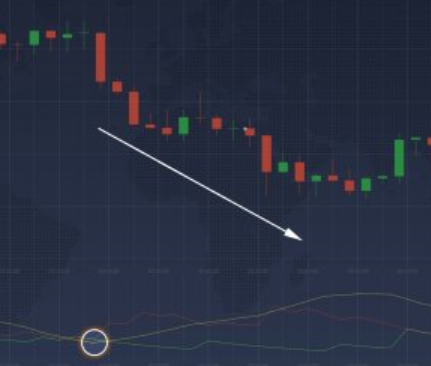
+DI and -DI bearish crossover.
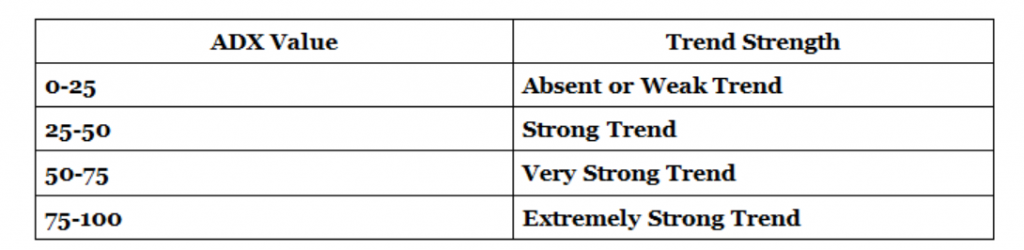
2) Trend Strength
Although the direction of the trend is important, it’s not the only thing that matters. The trend strength can make all the difference as it sets the amount of profit a trader can pull out of a deal. In certain situations trend direction might not even matter if the market volatility isn’t high enough.
The ADX can range from 0 to 100. ADX readings bellow 25 are indicating big trend weaknesses. From 25 to 50 the trend is considered strong, while reading above 50 show utmost trend strength.
Average Directional Index is best used in combination with other indicators so to accurately show the future price action movement.
ADX Conclusion
The ADX is one of the most unique and most effective technical analysis indicator. In combination with other indicators, it becomes a great trading tool all traders love and praise. Following it alongside +DI and -DI lines makes it a great one-two punch determining both the trend strength and the trend direction as well.
As it is the case with most indicators, ADX should be used carefully for the most accurate results and predictions. However, there are cons to using this indicator and they reflect themselves in falling behind the actual trend, thus possibly providing you with the outdated and incorrect information.
Leave a Reply