What is IqOption Resistance and Support?
Resistance and support levels represent the significant levels plotted on the chart of an asset and the price generally retraces from those levels. Trend reversals and trading on breakouts are in among the most famous methods for selection of entries into the market.
Resistance and support lines basically represent the most obvious indicator for technical analysis. You are to use them at the very least, since traders and investors from all over the world heavily rely on those lines.
Resistance and support lines plotted on the chart
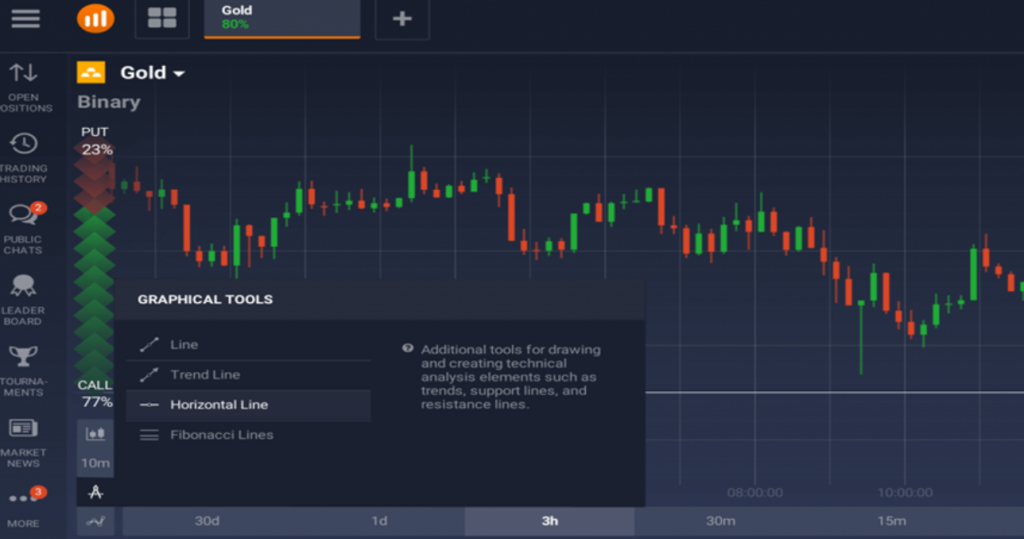
You are able to draw those lines on absolutely any types of charts: candlestick, bar, line and/or area. However, in case of other forms of technical analysis, those lines can be seen better on bar charts and candlestick (images are clickable):
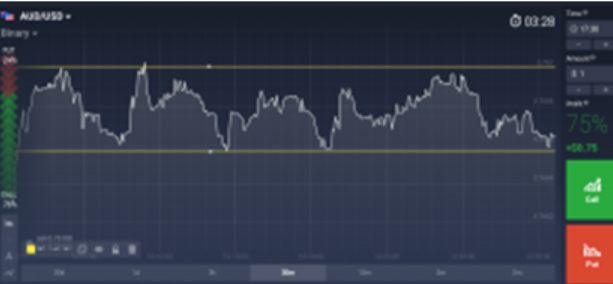
IqOption Area chart
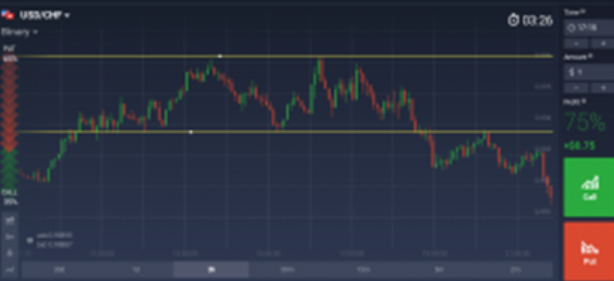
IqOption Candlestick chart
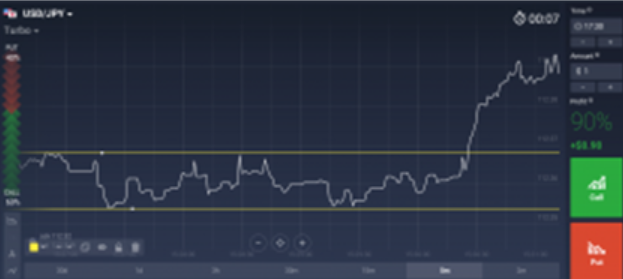
IqOption Line chart
IqOption Bar Chart
Resistance and support levels assist to all traders in finding the best point for asset purchase while the price is falling, as well as cases when it is possible to rely on the increasing price.
As can be seen from the descriptions and diagrams above, resistance and support levels basically use the price chart to display the peaks and troughs on it. Those extremes of local price represent the very trading foundation. Basically, they reflect the financial market law – buyer’s demand and seller’s supply. Resistance and support levels are shaped on the chart due to the fact that bidders follow and rely on the price level that was reached by prices last time. Basically, bidders do not prefer risking and start getting rid of current positions while they are still at a level that is safe.
Traders using resistance and support levels, develop strategies both for breakouts of the level as well as rebounds from the level.
Rebounds
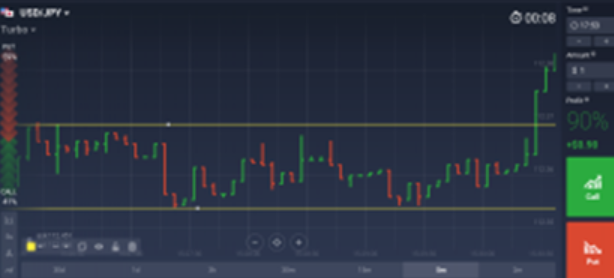
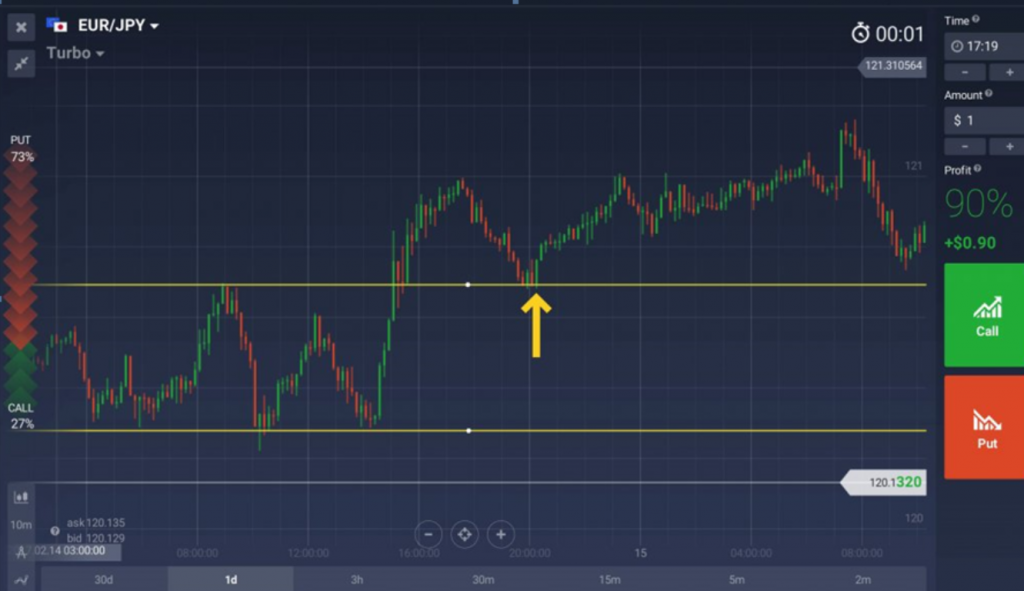
Once the price starts approaching the levels that it has previously bounced from, there is high likelihood that it will rebound again, hence creating a price channel (fig.1)
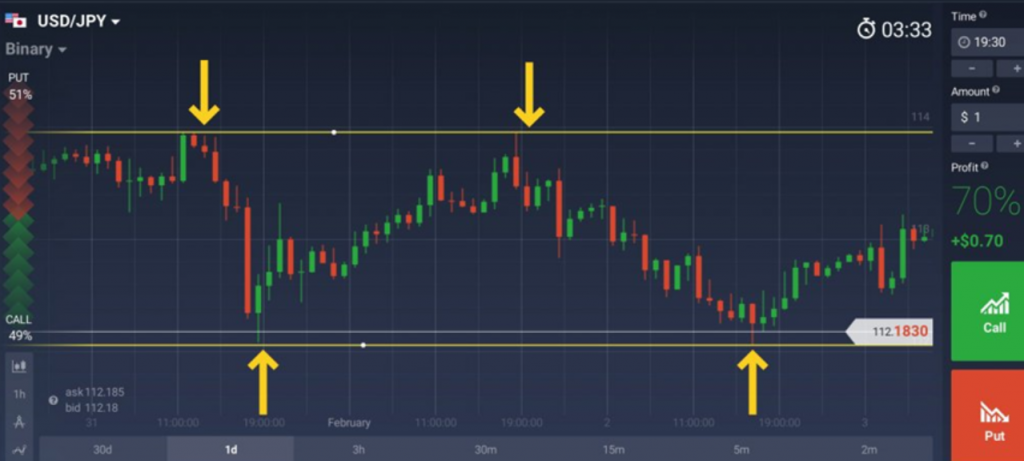
Figure 2 displays the movement of price in a flat manner with clear boundaries. The flat’s upper limit acts as resistance, while the lower limit acts as a support for the market. The first effective point of entry to the market for purchasing is the rebound moment from the level of support, while taking all the profit from the opposite boundary.
Likewise, the selling entry point represents the rebound moment from the resistance level located at the upper edge, while taking the profit at the level of support. In addition to the horizontal levels of resistance and support, there are inclined levels as well. Those levels are trend lines (Fig.2)
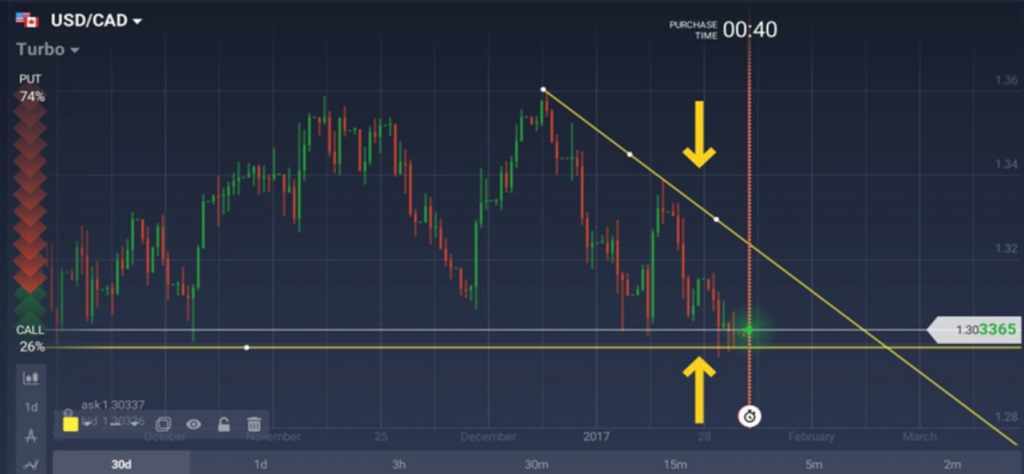
Trend lines denote the price movement direction. They are constructed with help of local minimums of the uptrend as well as maximums of the downtrend.
Trend trading is deemed to be effective in cases when there is strategy of using horizontal levels (Fig.3)
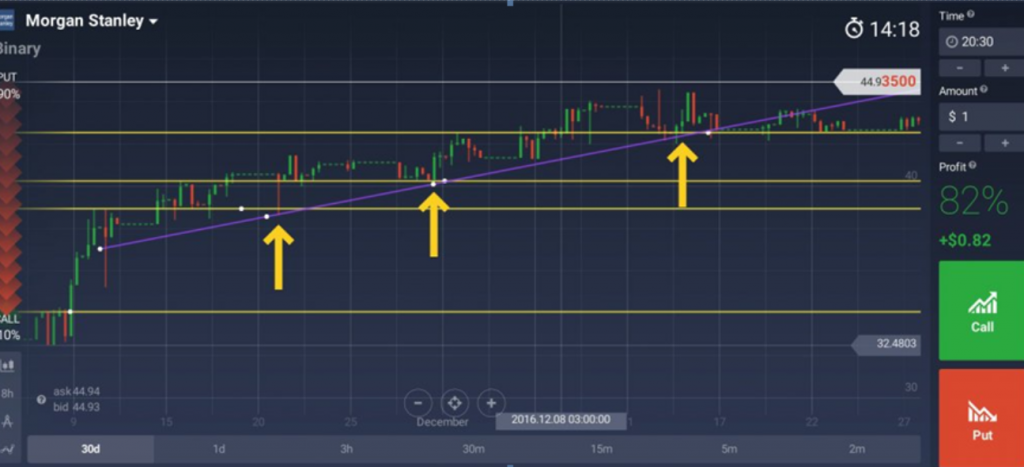
After a breakout price resistance levels can support the price in the future. That is clearly displayed in Figure 3. The arrows show the entry points for purchasing. The entry is performed on retracements of price in the trend direction.
When the retracement gets stronger and the price happens to break through the support of a trend, then another strategy is applied, which suggests breaking out of the resistance and support levels.
Breakouts
Breakouts of the resistance and support levels represent a perfect opportunity to catch a momentum with strong price. This kind of approach is harder to be applied, because it requires the trader to almost constantly keep monitoring the market in order not to miss the entry point. A lot of traders taking advantage of the breakout prefer not to perform the entry immediately, but rather choose to wait until the retracement after breakout happens, and then perform entry (Fig.4).
Fakeout
Breakouts of the resistance and support levels can be both fake and real. False breakouts usually tend to mislead traders, because the price has already broken through the level and is supposed to remain on a good wave. However, the exactly the opposite thing happens – the price return back behind the level and moves in the opposite direction (Fig.5):
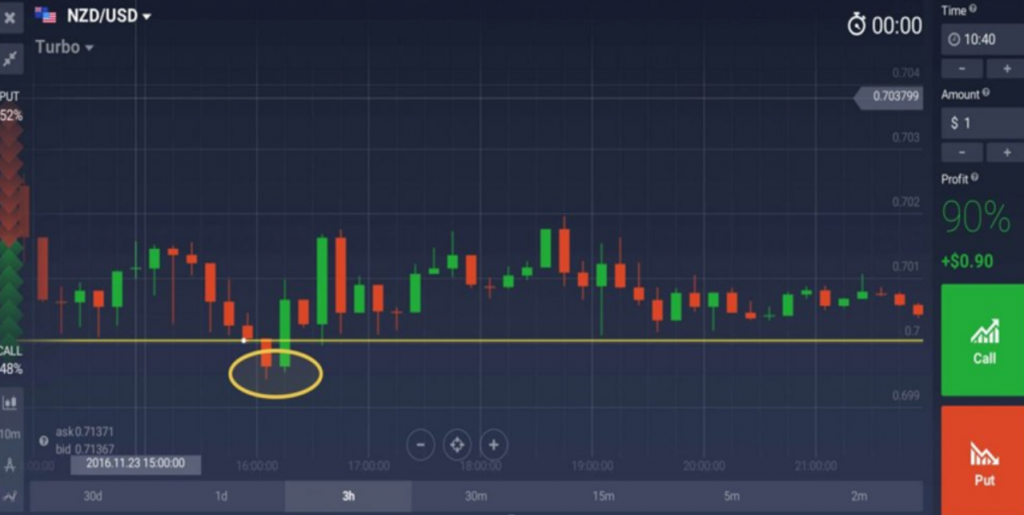
IqOption Figure 5. False breakout of the support level
In such situations it is always best to wait until the next candlestick closes after the break and then perform an analysis of the situation in the market. If the price returns after the breakout, while the candlestick appears opposite to the breakout, then it may be another fakeout.
In the case of a true trend breakout, it is advised to perform the entry with the retracement after the breakout, as illustrated in Figure 4.
Conclusion
Trading on resistance and support levels benefits from the psychology of masses – market participants tend to focus on past price behavior in similar situations. They measure the minimum and maximum prices within the current interval of time (e.g. during the previous week), and analyze the events happening during that time or that could have happened soon. If the asset-related background information doesn’t show any disturbances and there are no other events affecting that particular asset more than during the previous week, then the logic suggests an assumption that the price will stay within the same corridor in future.
To be able to execute an effective trading with help of that method, it is required to learn how to construct resistance and support lines as well as monitor the background news in order to avoid any unexpected breakouts.
Leave a Reply