- Home
- Trading Indicators
- ADX Indicator
- Alligator and Analysis
- Fisher Transform Indicator
- IqOption ATR Indicator
- IqOption Awesome Oscillator
- IqOption Bollinger Bands
- CCI and MA
- CCI indicator
- Center of Gravity Indicator
- Chande Forecast Oscillator (CFO)
- Detrended Price Oscillator Indicator
- Elliott wave principle
- Fibonacci Lines
- IqOption MACD Indicator
- IqOption Indicator Moving Average
- Parabolic SAR Indicator
- Parabolic Stop and Reverse
- RSI Indicator
- RWI indicator
- Stochastic lines
- Stochastic Oscillator
- Stochastic Power Trading
- Support & Resistance
- Technical Analysis
- Trading Education
- Make Deposit
- Registration
- Log In
- Withdraw
- Reviews
- About Broker
- Android App
- iOS App
- IQBroker
- IqOption Affiliate program
- Iq Option Careers & Work
- IqOption in India
- IQ Option Facebook
- IQ Option Instagram
- Is IQ Options safe?
- Is Scam?
- IqOption Mobile Application
- Problem with Iqoption
- Trading Features
- Tips
- Why demo account?
- USA traders
- Vimeo
- YouTube
- F.A.Q
RSI Indicator
RSI Indicator how use it on IqOption?
Entire trading community continuously applies RSI indicator to determine overbuying/overselling levels in today’s market. This indicator functions well without application of other extra filters. Take a look on RSI application, which further increases the indicator accuracy. Traditional method of using RSI: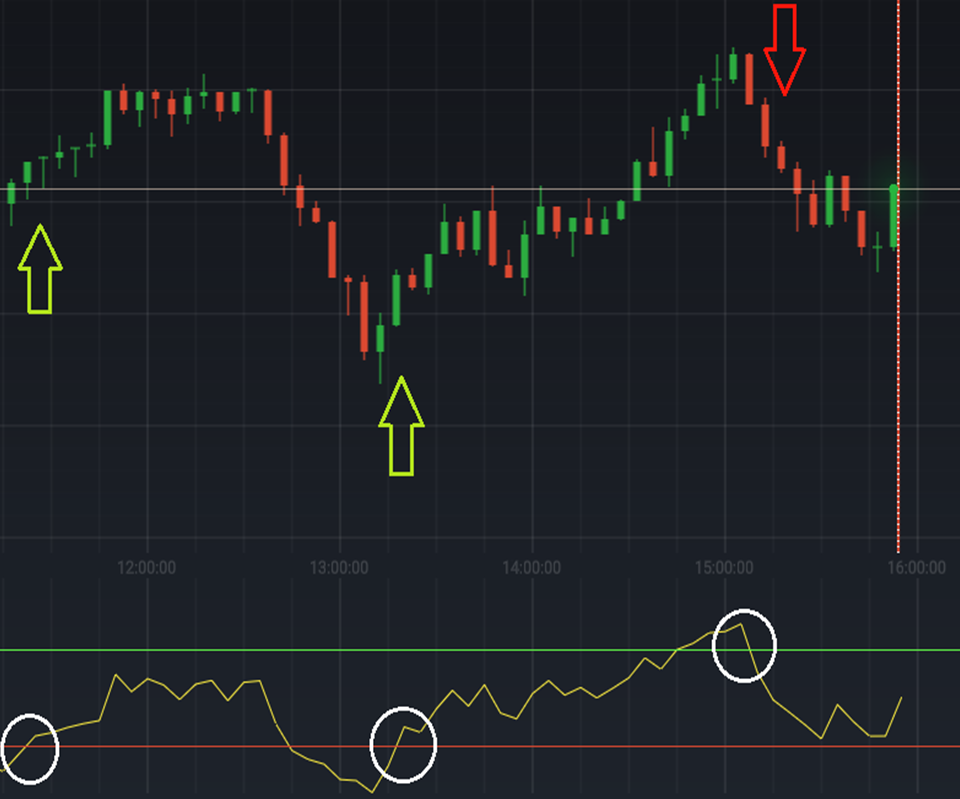
Traditional method – purchase of option once RSI exits the overbuying/overselling zone. Once the RSI line value goes below the overselling level of 30% generally it denotes the exit of an indicator from that zone and means that it is the right time for initiating the raise in position; Once the values go above the overbuying level of 70%, generally it means that the downturn is about to happen. The best moment to buy an option is when the indicator starts going out of the overselling/overbuying zone.
What is RSI indicator? How to use RSI indicator on IqOption?
Iqoption RSI and minor timeframes
Here is an alternative option. If you prefer trading binaries or turbo options, which have an expiration time of than 30minutes and less, then 70 and 30 levels may not always allow to perform entering with accuracy. The period for an indicator to reach the extreme values should be decreased to a more frequent level. For timeframes lower than one hour it is advised to use RSI values of 5 and 90 and up to 10 or even 95 to 5. Refer to an example of adjusting Rsi to 90/10 values with 5 period:
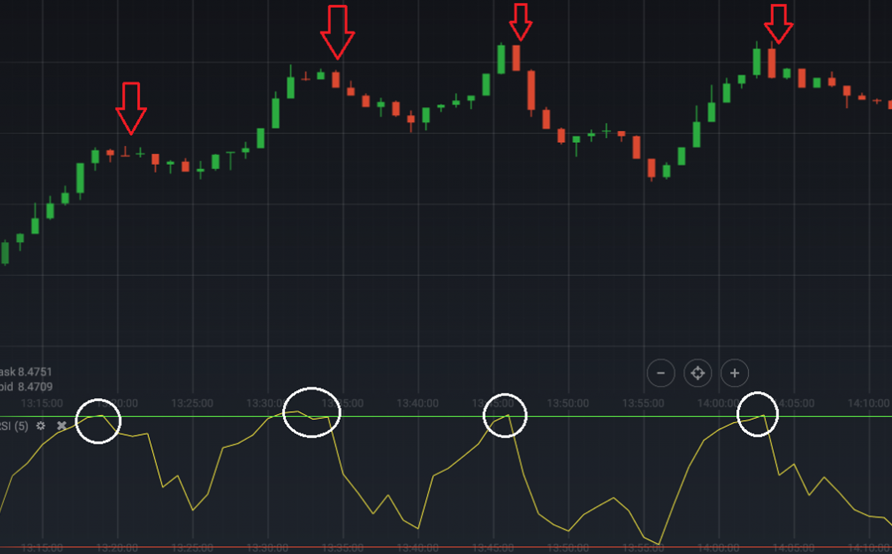
Third option. In order to get an additional approval, you should pay attention to higher periods to be able to see the global trend. It is a bad idea to trade binary options that are opposing the trend. Hence, the direction of signal on current timeframe and the one above should match. This is how signal approve appears on a 1-minute and 5-minute charts:
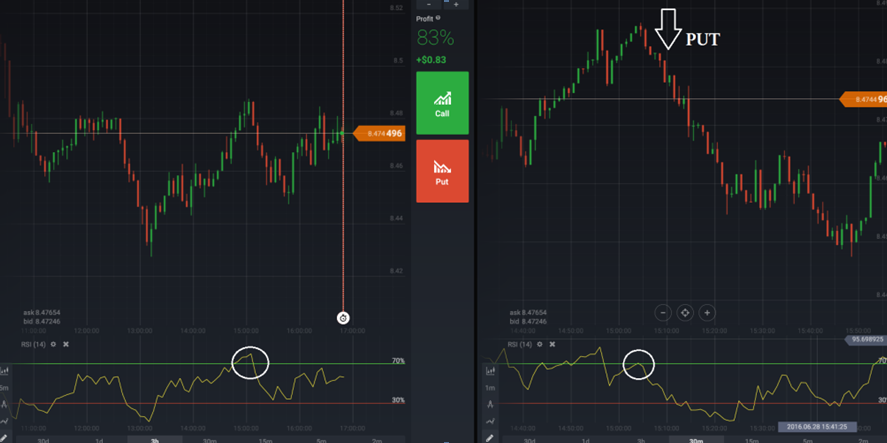
RSI with longer timeframe M5 approves the signal from the chart M1
Levels and period of RSI are to match each other on both charts. Option number 4. Super-short deals can be done using scalping technique. Such method of trading is applied frequently by lots of American traders. The key part of the strategy is to obtain a big amount of signals within a short time period. The main objective is to minimize the response time of an indicator as much as possible. Settings: RSI period is equal to 2 bars; Overbuying limits are set to the maximum values -1 for overselling and 99 for overbuying. This type of strategy is also used on M1 or M5 charts. Expiration time for binary option is usually not more than 5 minutes.
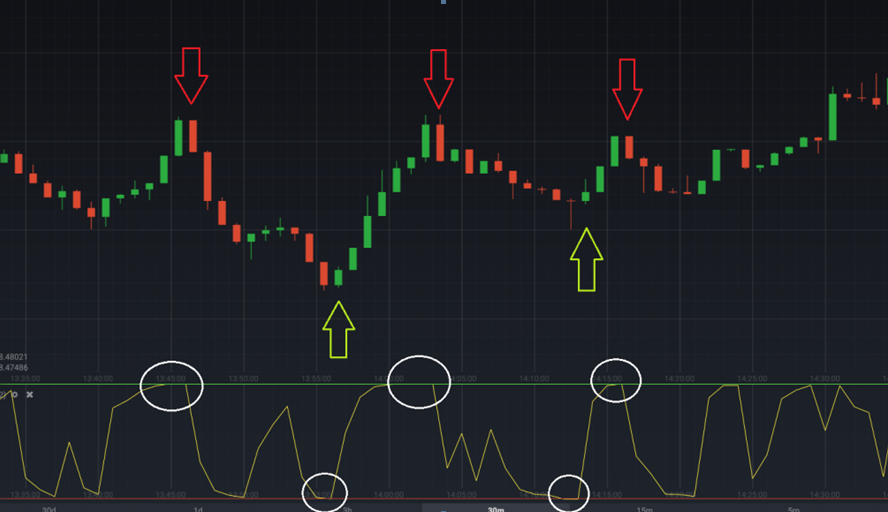
Setting RSI used for scalping
IqOption Divergence of RSI
Option number 5 – divergence search on chart can also be an effective method to get RSI signals. Divergence basically represents a dissimilarity between indicator values and chart, e.g. when the chart displays higher values while indicator shows lower maximum. A good example of divergence – when two maximums on chart are at the same level, while the second maximum is higher on the indicator chart:
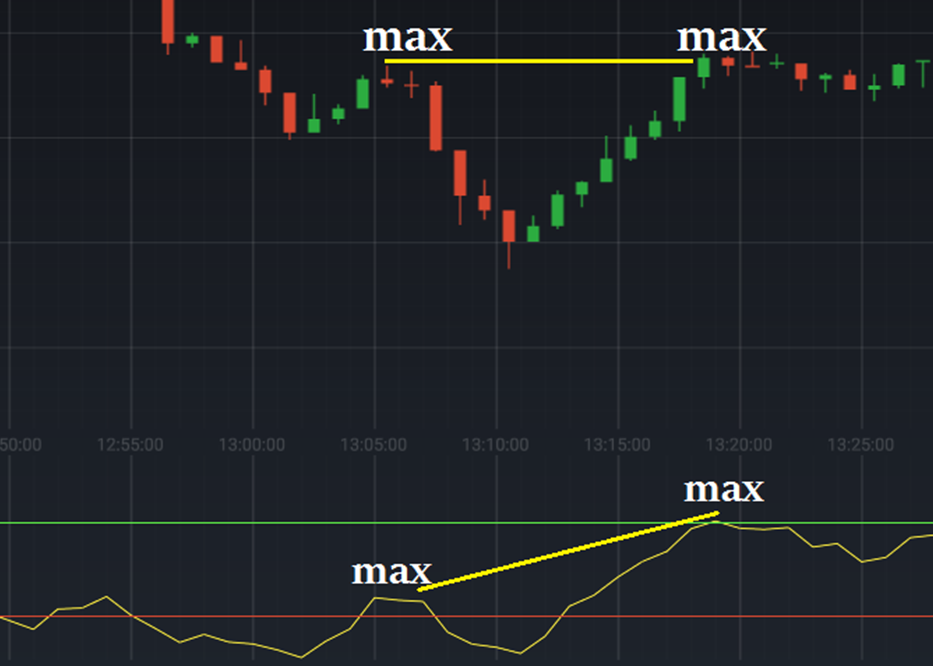
Divergence of RSI
Things to always remember – you should trust indicator, if it goes up – we buy option CALL, if it goes down – PUT.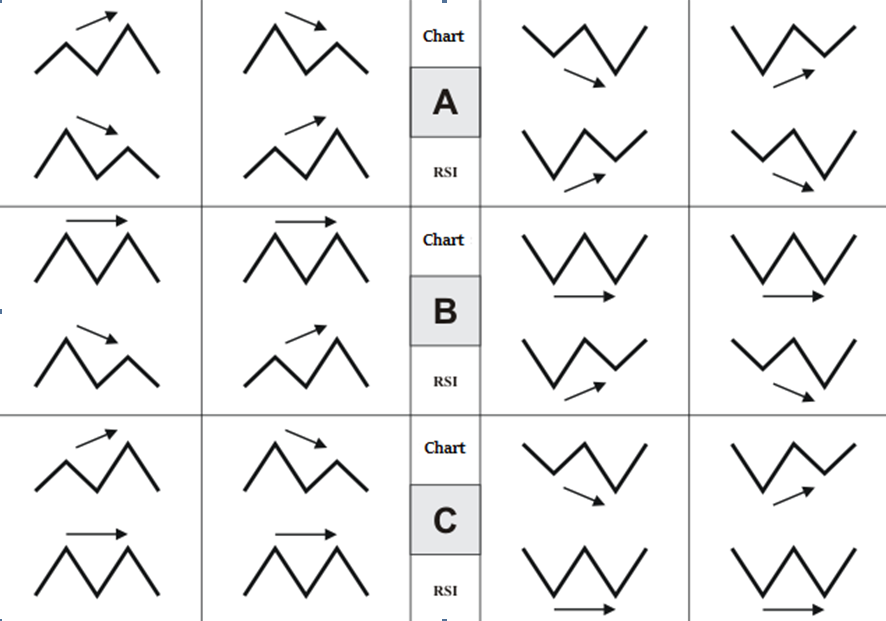
Types of RSI divergence
Example of entering the position based on divergence of RSI: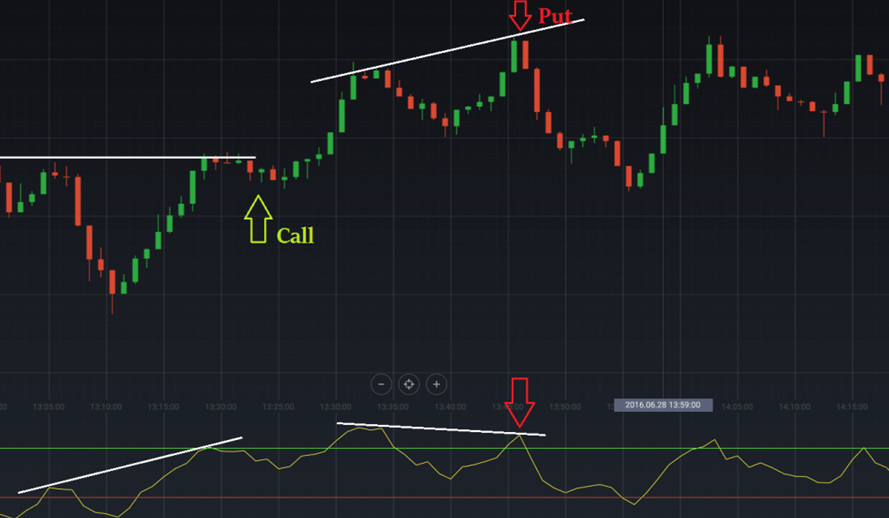
Entering the position based on divergence of RSI
IqOption RSI & Bollinger Bands
The last option – to combine Bollinger Bands and RSI indicators, since because the first one shows the main direction of market movement, while the second one shows impulsive movements. As a result, you receive signals to enter the position, which are very precise. The rules of RSI trading are generally standard. Buy PUT option once the time indicator line exits the overbought zone, otherwise use CALL option, once indicator line fully exits the oversold zone. However, keep in mind that you should enter only when the price is located close to the bottom of Bollinger Bands line, which basically acts as a filter. In ideal situation, the price is supposed to over-cross the line exactly by the moment when RSI signal is received. In situation with РЎall signal, the opening price of the breakout candlestick should be located above the line. The closing price is above:
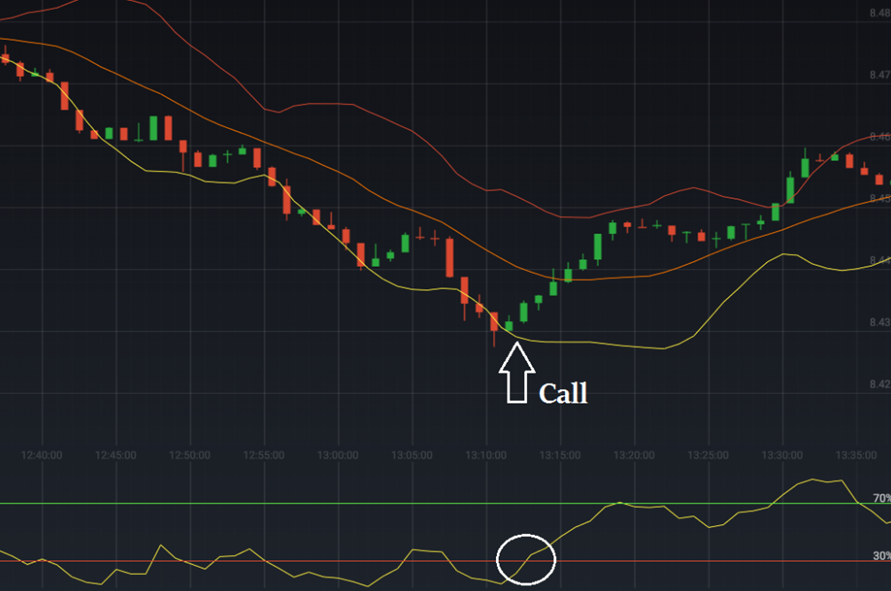
CALL Signals with filter of Bollinger bands
The same rules are applied to PUT-signal: the price should cross simultaneously the top line of a channel – i.e. the opening price is higher and closing price is lower (inside of the channel):
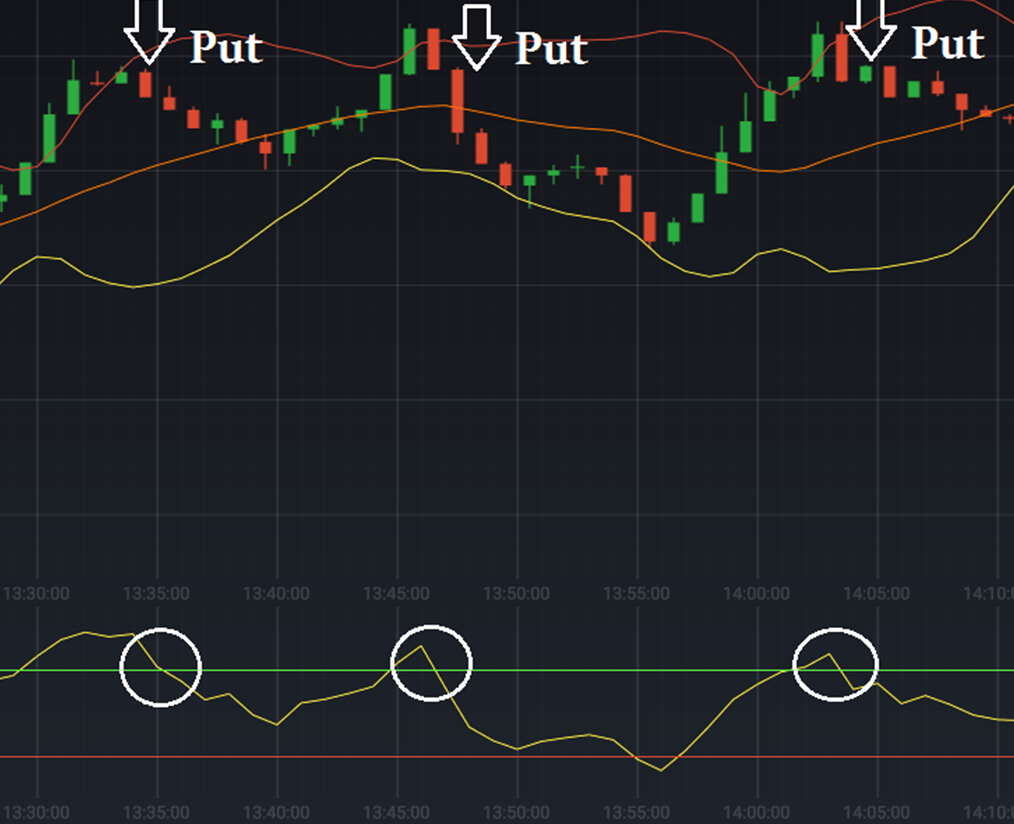
PUT signals with filter of Bollinger bands
The time of expiry can be different based on timeframe used. In ideal conditions, the time of expiry should be equal to the amount of bars required to achieve the floating average (i.e. average line of the channel) from the channel edges. It is possible to calculate the average amount of bars required to pass the total distance from one edge to another edge and then divide it by 2.
IqOption Conclusion RSI
The most well-known and widely known indicators can become a strong basis for profitable trading strategy if it is properly applied. This article has described a number simple options to increase the percentage of successful deals with help of RSI strategy. You can Try using these methods with a free account for practice. Traditional indicators have already become properly integrated in trader’s lives, and many people already don’t consider them anymore as serious instruments for trading. Meantime, the majority of contemporary developments are still based on RSI or floating averages. The major benefit of RSI is the versatility, since the indicator can be used for currency pairs, as well as stocks trade and/or goods trade with similar success rate and without reduction of quality.
RSI: Steps to Set Up And Utilization for IqOption Trading
The index of relative strength (aka RSI) represents a momentum oscillator applied for measurement of the magnitude and velocity of directional movements of prices. This type of indicator is able to provide investors with appropriate signals to buy or sell once the respective asset is oversold or overbought.

RSI is able to vary from 0 up to 100%. It can be represented with a single line that fluctuates. The closer that line approaches the zero mark, the higher is the probability of the asset being oversold. In this situation, the price is expected to increase. Once RSI approaches the 100%, it means that the particular asset has higher probability of being overbought. In accordance with indicator, the price of an asset is expected to decrease.
This indicator was initially developed by J. Welles Wilder, an American engineer, developer of real estate and well-known technical analyst.
Back in 1978 this indicator has first appeared in New Concepts in Technical Trading Systems, author’s bestselling journal, as well as June issue of the journal called Commodities magazine (now renamed to Futures magazine). It has managed to become among the most popular oscillator indices. Nowadays, it is considered to represent a core indicator of the software used for technical analysis.
Application of RSI indicator for IqOption trading
As mentioned before, the RSI is able to oscillate between the values of 0 and 100%. Generally, the RSI is deemed as overbought once it exceeds 70% and oversold once it goes below the 30%. In case when the indicator causes many false alarms, it is also possible to increase the threshold of overbought values up to 80 and also decrease the threshold of oversold values up to 20.
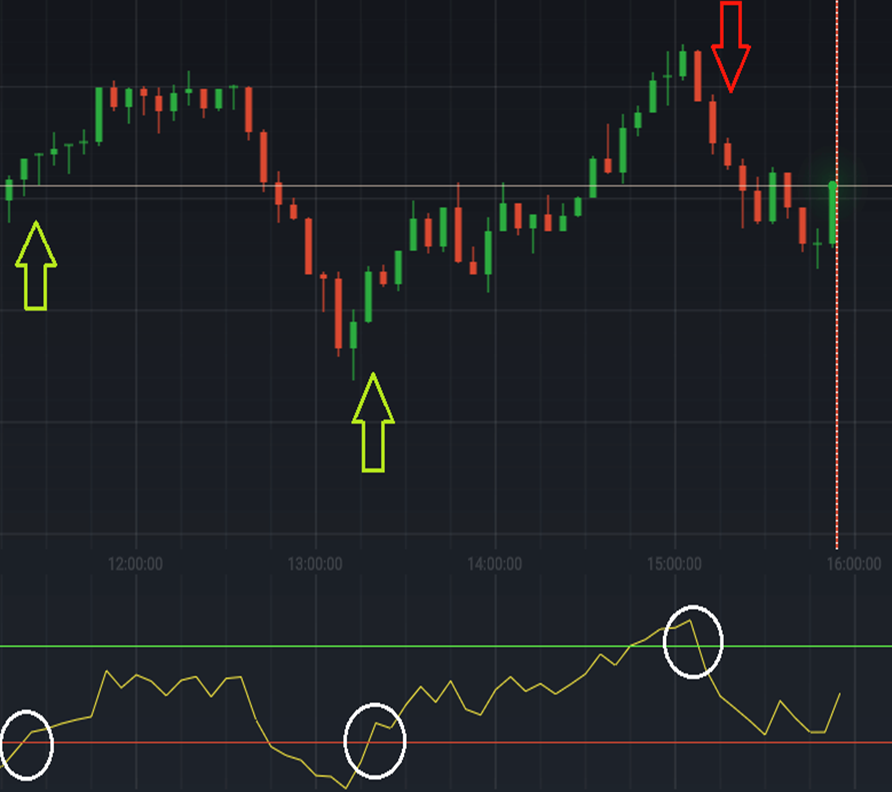
You can also refer to the following for additional information: 6 Ways to Get Maximum Gain from RSI Indicator
J. Welles Wilder prefers a smoothing period equal to 14. It can be adjusted to fulfill the objectives of short-term as well as long-term adaptability of strategy. Longer of shorter periods are applied for longer or shorter outlooks. RSI represents a universal indicator and can be applied for trading any types of assets starting from indexes and ending with derivatives and currency pairs. Keep in mind that in case of strong trends the RSI is able stay in the overbought/oversold zones within a long period of time!
IqOption RSI Configurations and Settings
RSI can be used for IQ Option trading platform, by activating the “Indicators” button located in the lower left screen corner. Just select “RSI” in the list of available indicators.
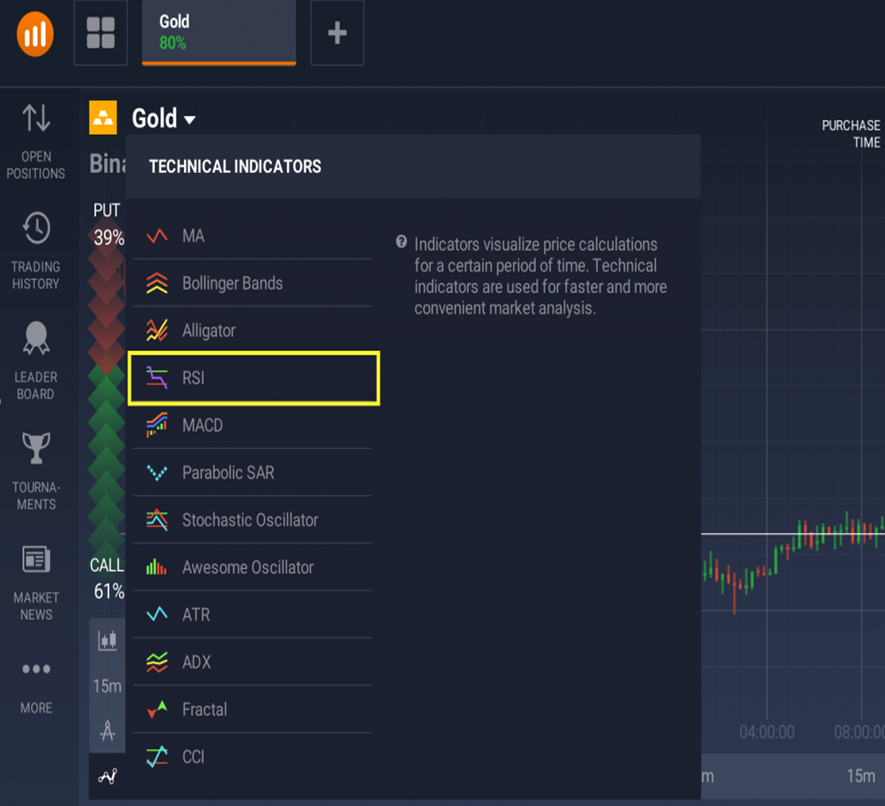
After that click the button “Apply” if you want to have standard settings. The graph of RSI will then be displayed at the bottom of screen. Expert traders prefer using the “Set up & Apply” tab. Select the settings of RSI: the liking period, levels of oversold and overbought to attain better accuracy/ sensitivity. Keep in mind that as the corridor becomes wider, the fewer signals can be received by you. However, those will have a better accuracy. In case when threshold levels get closer with each other, the crossover signals start appearing more frequently. However, that will also increase the amount of false alarms. Keep I mind that the increase of the “Period” parameter causes the indicator to become less sensitive.
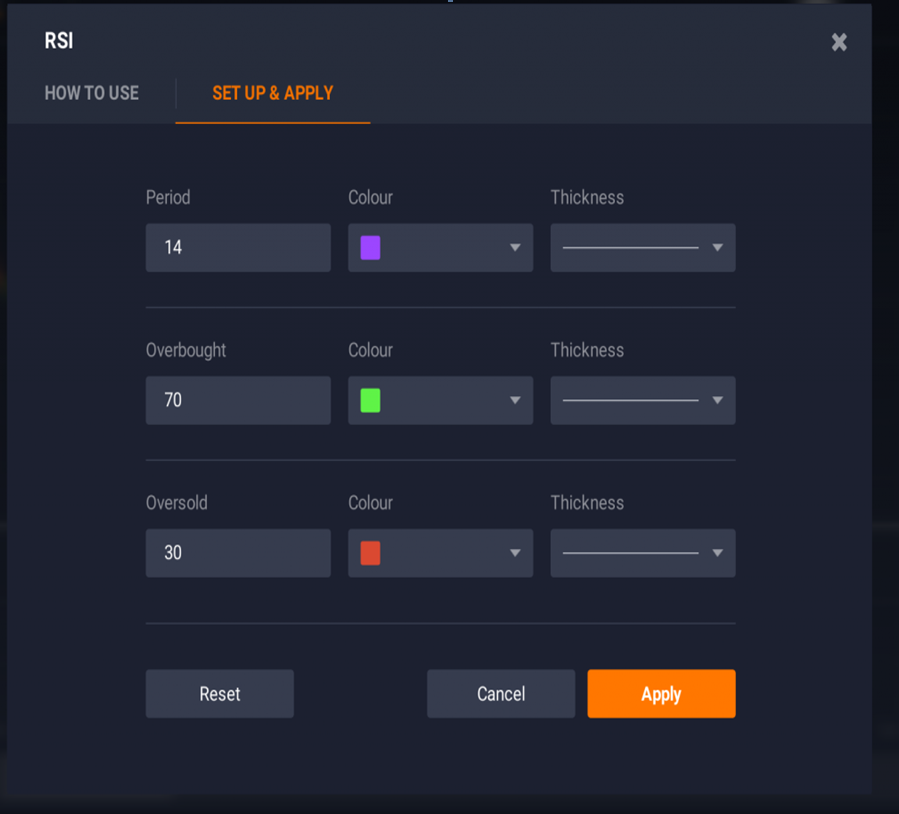
Iqoption RSI – General approach – 70/30
The overbought level 70%, oversold level 30% and smoothing period of 14 are applied for the general approach. This approach is used most frequently for this type of indicator. The RSI is expected to bounce from the threshold lines of 30 and 70. Standard parameters will cause the bouncing of threshold lines to occur quite often. However, that won’t definitely result in the actual change of the direction of trend.
Iqoption RSI – Conservative approach – 80/20
The overbought level 80%, oversold level 20% and smoothing period of 21 are applied in case of the conservative approach. Investors who don’t like to risk, prefer setting up the indicator with the abovementioned parameters in order to reduce the RSI sensitivity minimize the incorrect signals amount. Extreme low and high levels of 90 and 10 tend to appear less frequently but they also cause a stronger momentum.
Iqoption RSI – Divergence
Divergence represents an alternative strategy of using the RSI indicator. Once the RSI does not confirm the underlying prices movement, it can give a signal of a shift in trend.
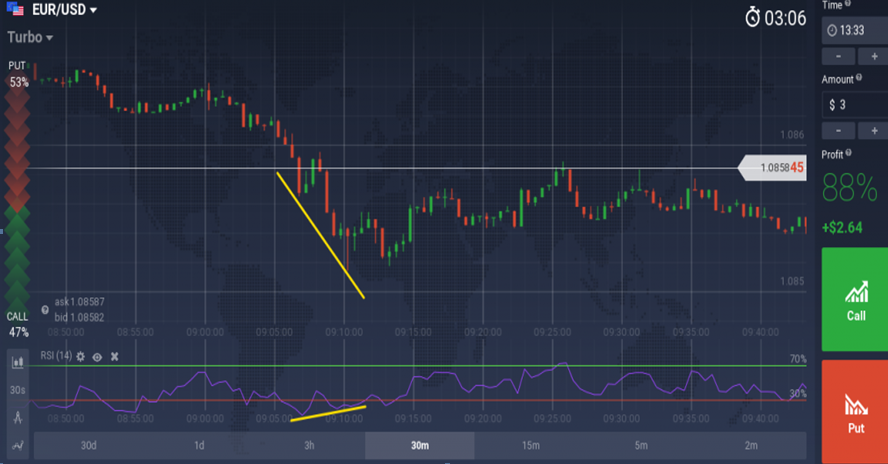
Divergence act as a useful indicator for the upcoming reversal of price. The abovementioned example shows that the asset price decreases, while the RSI displays the opposite movement. This occurrence is then followed by the shift of trend.
Iqoption Second Conclusion RSI
The RSI represents a powerful tool, which is able to notify traders when to start buying and selling. In certain situations, it is able to predict the trend that cannot be predicted by other indicators due to a lower operating speed. Nevertheless, RSI is rarely applied on its own, because it works best when combined with other types of indicators. The RSI is possible to be combined with other types of indicators in order to increase the overall efficiency and accuracy.
Search
7 Comments
How use Divergence of RSI and what is it?
A great indicator for testing on a demo account!
The analysis of this indicator is quite a complex process, so not all beginners want to face it because of the complexity
I don’t use indicators at all especially the RSI
I use RSI because it is the fastest among other indicators
This is some great advice, loving the in depth explanation and tips, rather then just talking simple signals.
RSI is really great tool to predict graph. I use this tools during all trading day.